I) What are the different components of this infographic?
II) What is the difference between a Direct Implementing Partner and a Sub-Implementing Partner?
III) What information does this infographic provide?
a.GMS Focus: Aggregate by Partner Level vs. Aggregate by Partner Type filters
IV) How to access more precise data, including the exact allocated amounts?
Through the Grant Management System (GMS), CBPFs allocate funding to UN agencies, national and international NGOs, and Red Cross/Red Crescent National Societies. In turn, those implementing partners may sub-grant part of their initial grant to a third party, called sub-implementing partners.
The Allocation Flow visualization draws from the GMS data related to the funding disbursed to CBPF partners. It provides an infographic to track the funding flow between direct partners (i.e., Implementing Partners) and indirect partners (i.e., Sub-Implementing Partners).
I) What are the different components of this infographic?
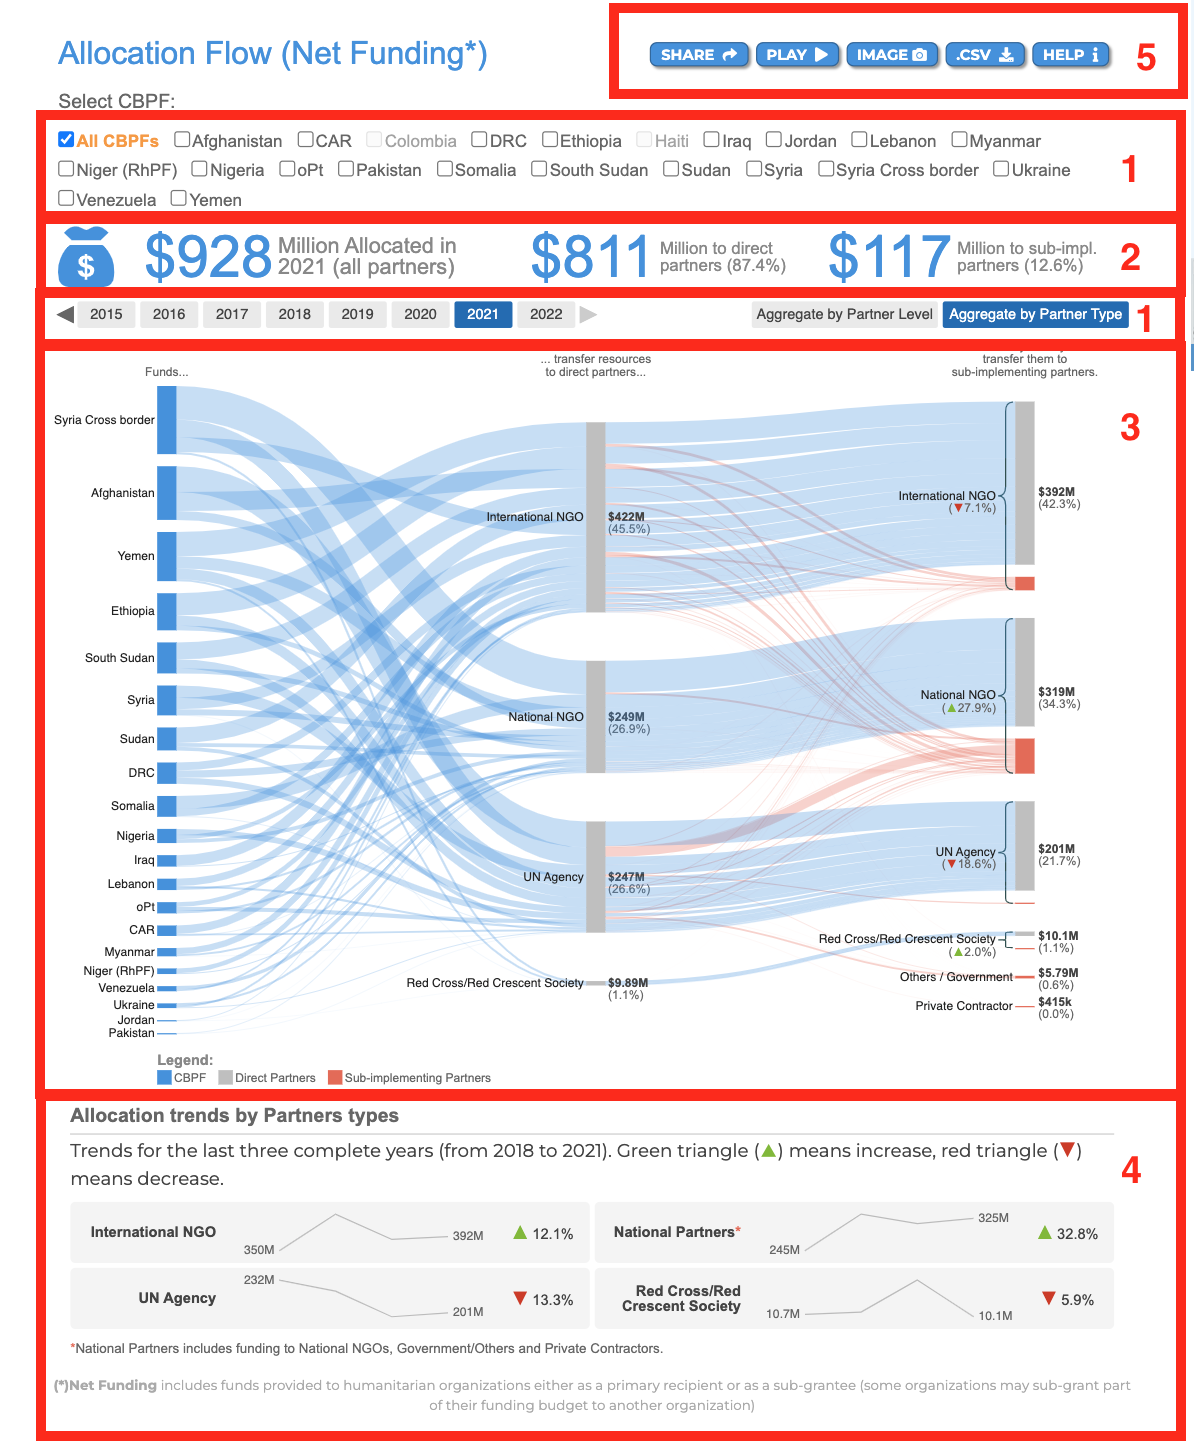
Please see below the description of fields 1-5 as annotated in red in the screenshot above.
-
The filters option: users can apply these filters to personalize the data.
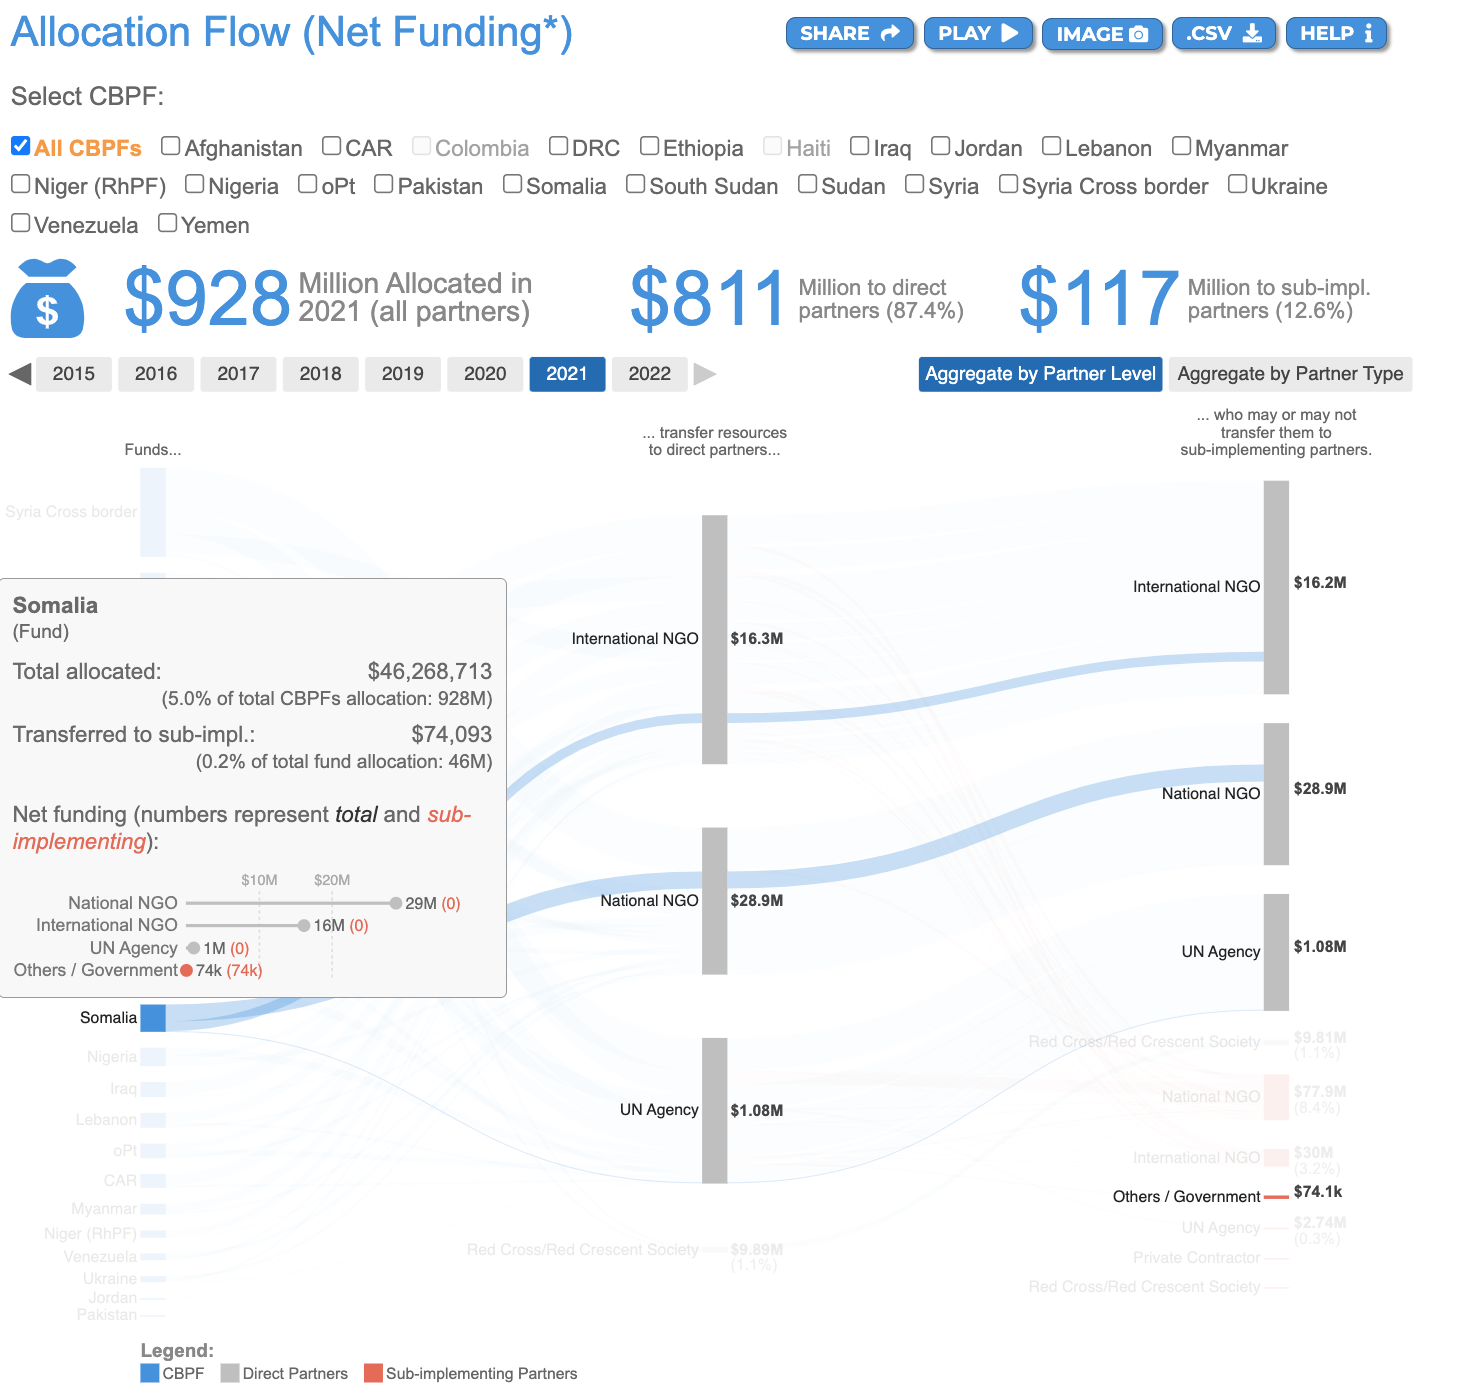
a. CBPFs: select one, several or all CBPFs. The greyed CBPFs are those that were inactive for the selected year(s).
b. Year: select one allocation year by clicking on it, or multiple allocation years by double-clicking on them.
c. Aggregate by Partner Level and Aggregate by Partner Type: please see our GMS Focus below to know more about these two filters. -
The Allocations’ key figures: they reflect the filters applied, and give the following information:
a. The amount, in USD million, allocated to all partners.
b. The amount, in USD million, allocated to direct implementing partners only.
c. The amount, in USD million, allocation to sub-implementing partners only. -
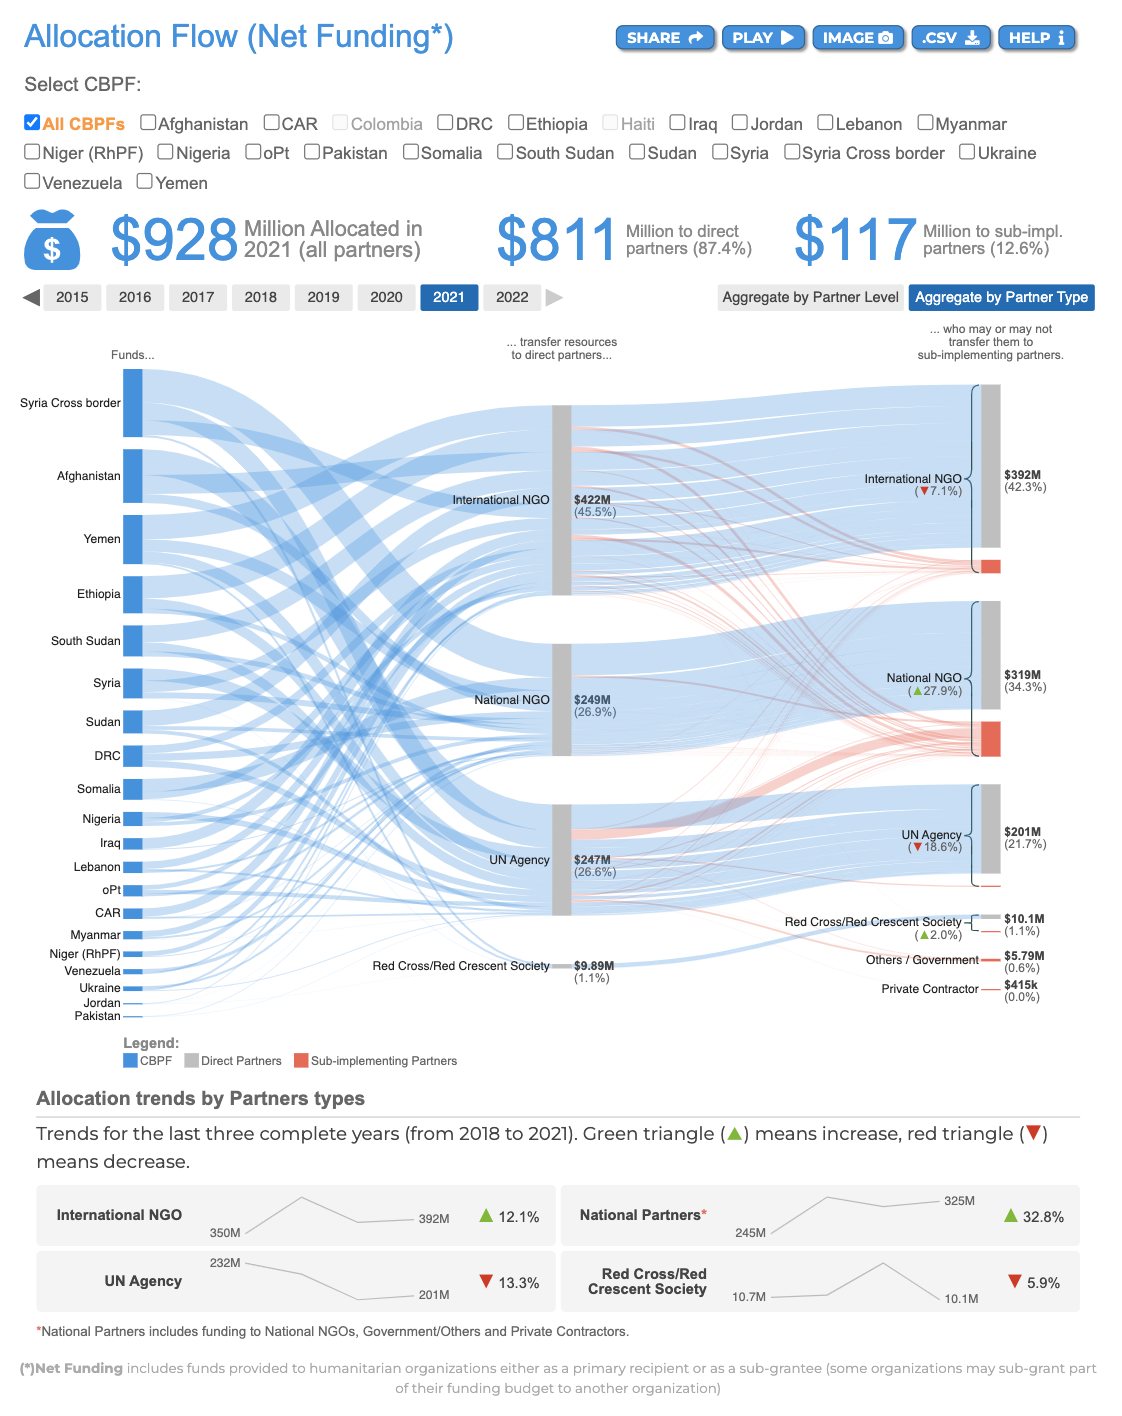
The Alluvial Diagram: it’s the main visual, and the core of this infographic. It provides an overview of the funds allocated, focusing on the recipients, whether direct or sub-implementing partners.
-
The Sparklines allocation trends per partner type: this section displays the allocation trends according to the partner type, for both direct and sub-implementing partners together. The trends are calculated over the last three years.
-
The usual CBPF Data Hub tooltips: Share, Play, Image, .CVS, and Help. To know more about these tooltips, please click here.
II) What is the difference between a Direct Implementing Partner and a Sub-Implementing Partner?
Direct Implementing Partners: whether they are UN agencies, national and international NGOs, or Red Cross/ Red Crescent National Societies, direct implementing partners are the main recipients of the funding granted by the CBPFs. They are the primary party filling in, submitting and reporting on the funded projects.
Direct Implementing Partners can work in tandem with a third party, for instance to implement one specific activity of their logical framework, due to the third party’s special knowledge/skillset. Consequently, the Direct Implementing Partner can decide to sub-grant a part of the funding to this third party, to fund the specific activity/ies. This third party is called the Sub-implementing Partner.
In the Alluvial diagram, Direct Implementing Partners appear in the second and the third columns, in grey.
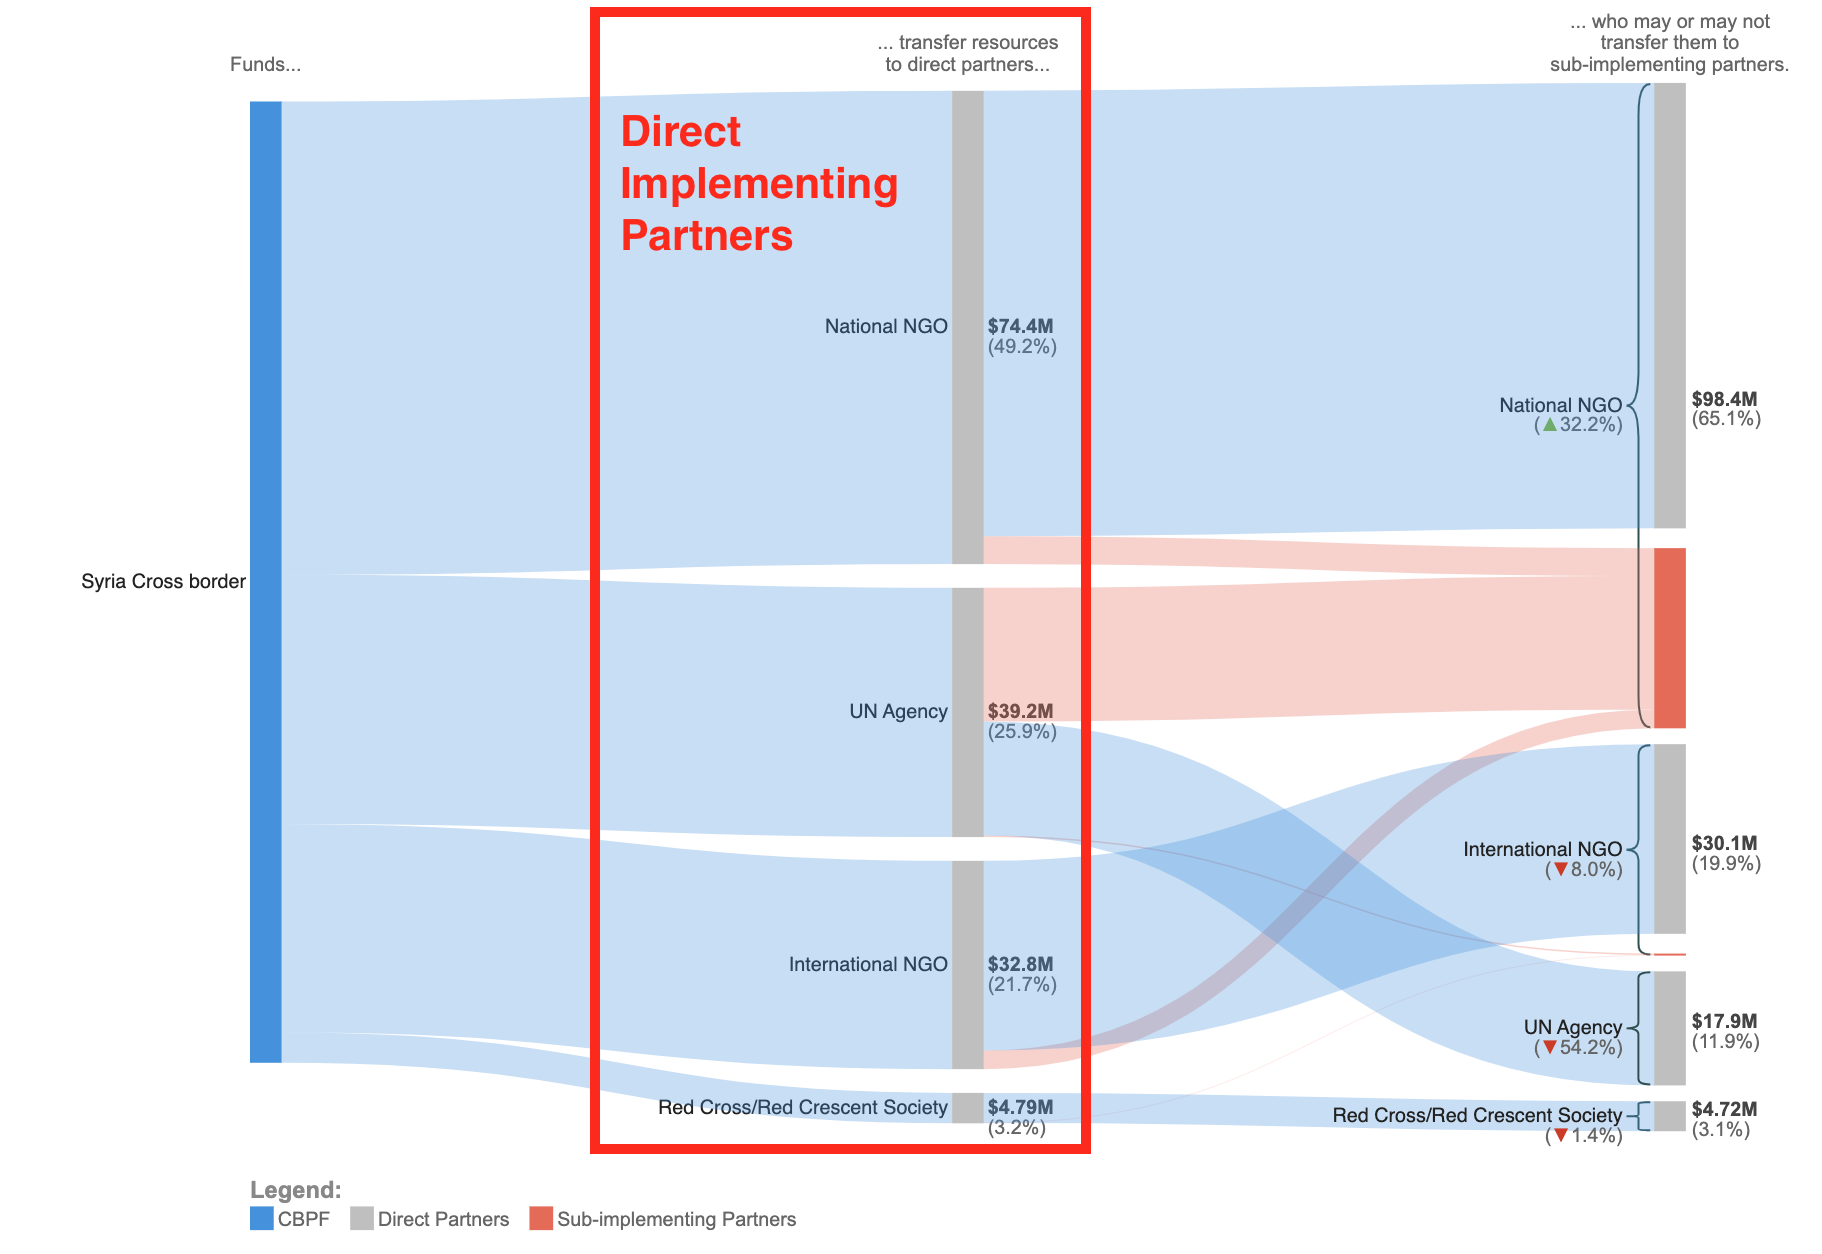
Sub-Implementing Partners can be UN agencies, national and international NGOs, or Red Cross/ Red Crescent National Societies, or other parties, such as governmental entities and the private sector. They neither fill nor submit project proposals on the GMS. Nevertheless, they are stated by the direct partner in the project proposal and the Grant Agreement as third parties, and they do implement specific activities as per the approved project proposal. Hence, they receive a portion of the CBPF funding from the Direct Implementing Partner (and not from the CBPF themselves) to successfully do so.
In the Alluvial diagram, Sub-Implementing Partners appear in the third column, in orange.
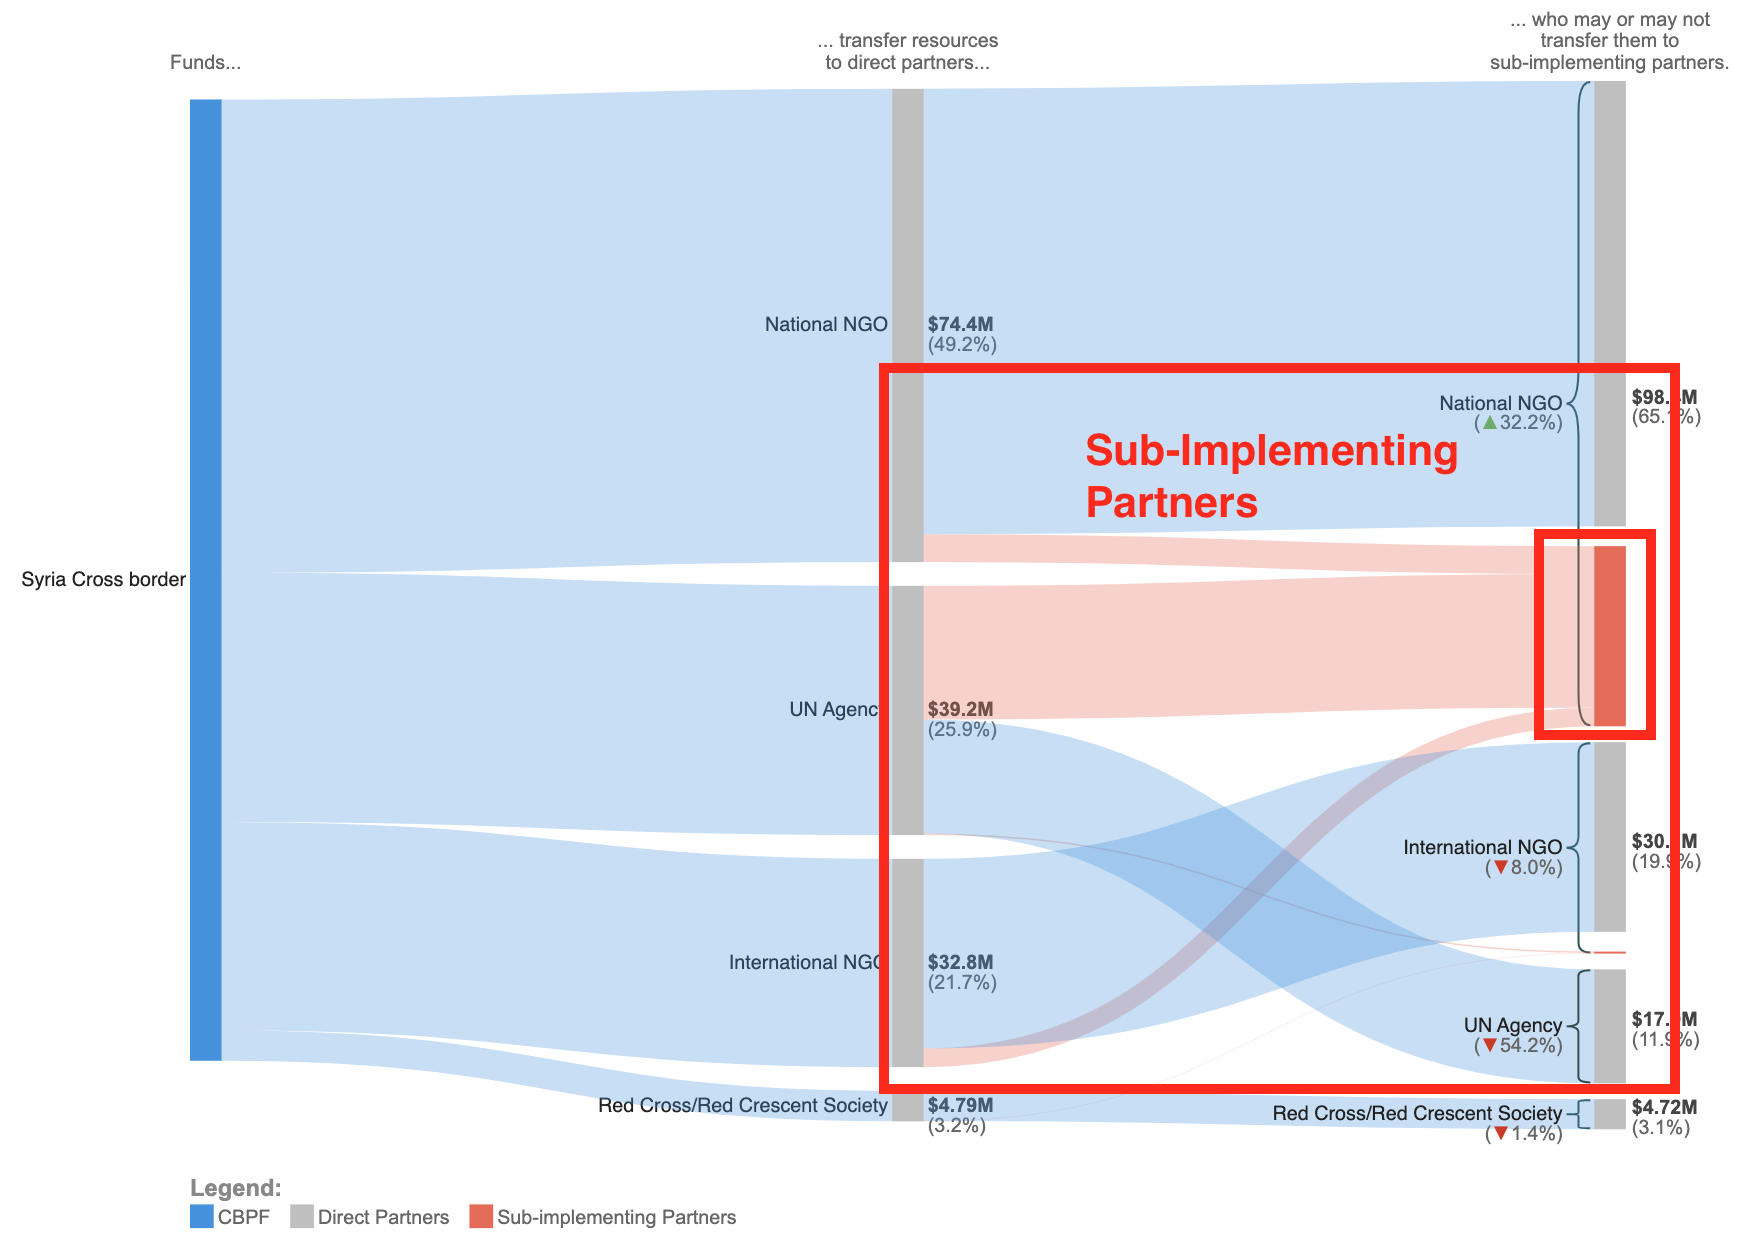
III) What information does this infographic provide?
Tracking the amount of funding that is either direct grant, or sub-granted to third parties is at the core of this Allocation flow visual, as the alluvial diagram presents the breakdown of direct grants (blue) and sub-grants (orange) to humanitarian partners.
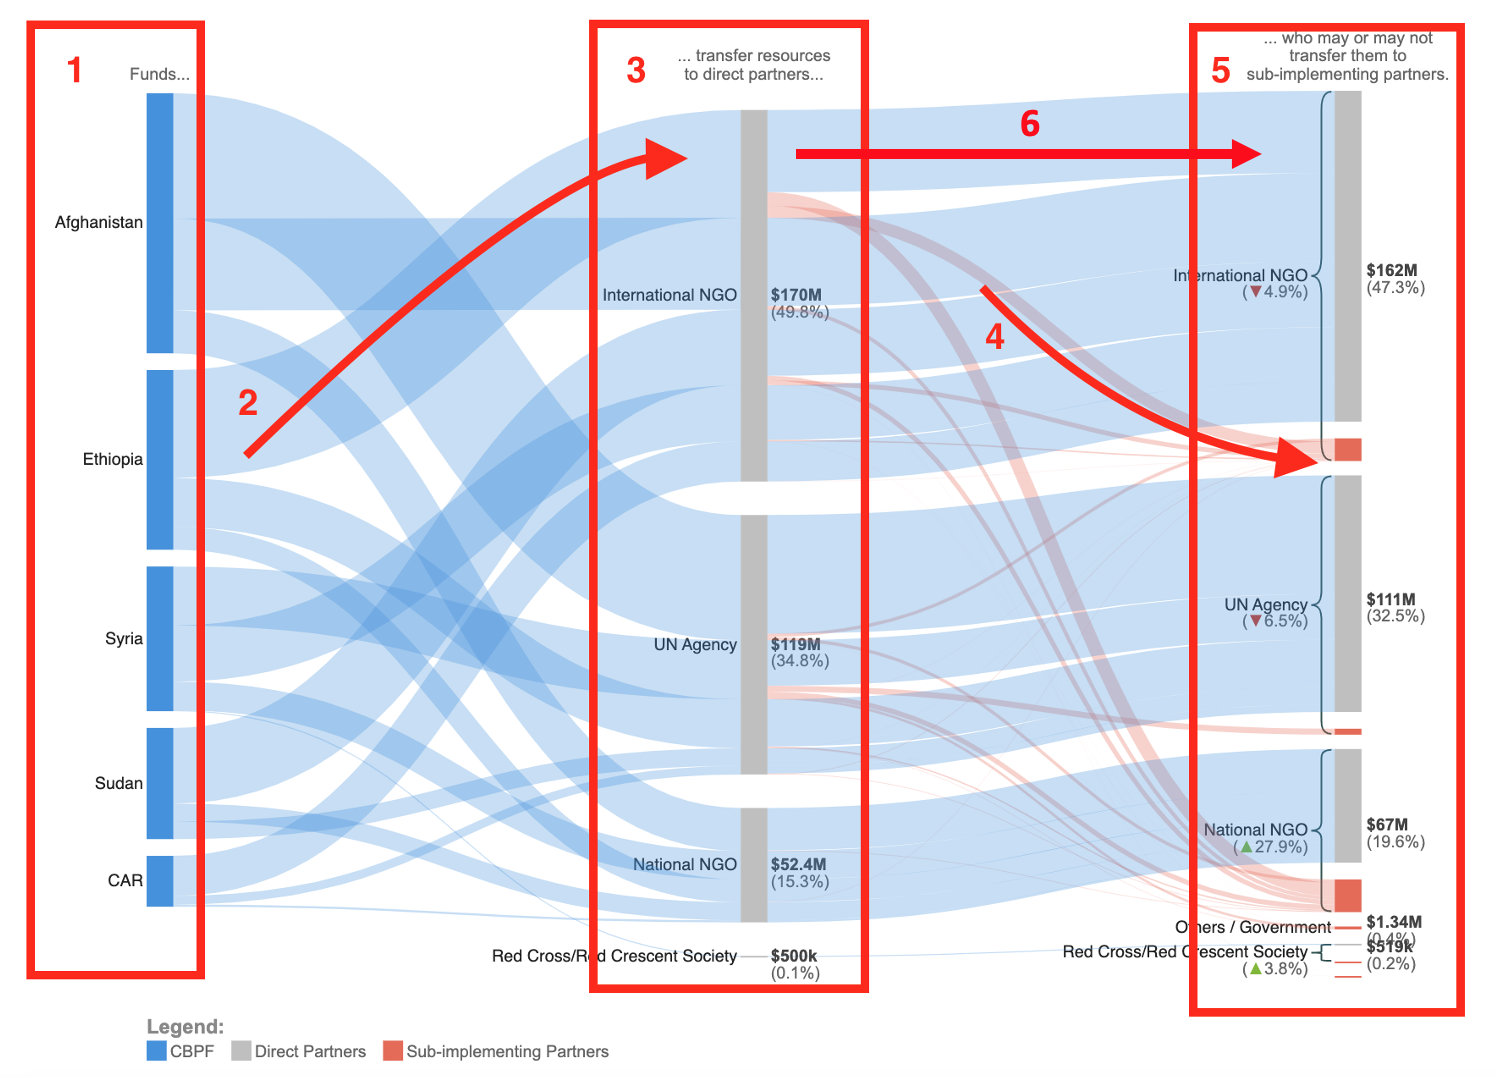
1. CBPFs.
2. Direct grants– blue flow.
3. Direct Implementing Partners by type.
4. Sub-grants (amount that is sub-granted to a sub-implementing partner) – orange flow.
5. Sub-implementing partners (represented in orange) / Direct Partners (represented in grey) - by type.
6. Direct grants (amount that is not sub-granted, that is kept by the direct implementing partner) – blue flow.
Please note: the third column comprises both Direct Implementing Partners in grey AND the Sub-Implementing Partners in orange. The Direct Implementing Partners are also included in this third column to allow a visualization of the grant amount they did NOT sub-grant, i.e. the amount they kept.
As you can see in the visual, Funds, represented in the first column (1 on the screenshot) disburse the funding, represented by the blue flows (2 on the screenshot), to Direct Partners, which are represented in the second column (3 on the screenshot). In turn, the Direct Partners can keep the funding to themselves, meaning they did not require a sub-implementing partner to carry out the project activities. This is represented by the blue flows between the second and third column (6 on the screenshot).
OR, the Direct Implementing Partners can sub-grant a percentage of their direct funding to a Sub-Implementing Partner. The sub-grants are represented by the orange flows (4 on the screenshot). Users can see the partner type for Direct Partners in grey and for Sub-Implementing Partners in orange (5 on the screenshot).
The larger the flow in the visual, the higher the grant/sub-grant amount.
The Sparklines’ section, or the allocation trends by Partner types
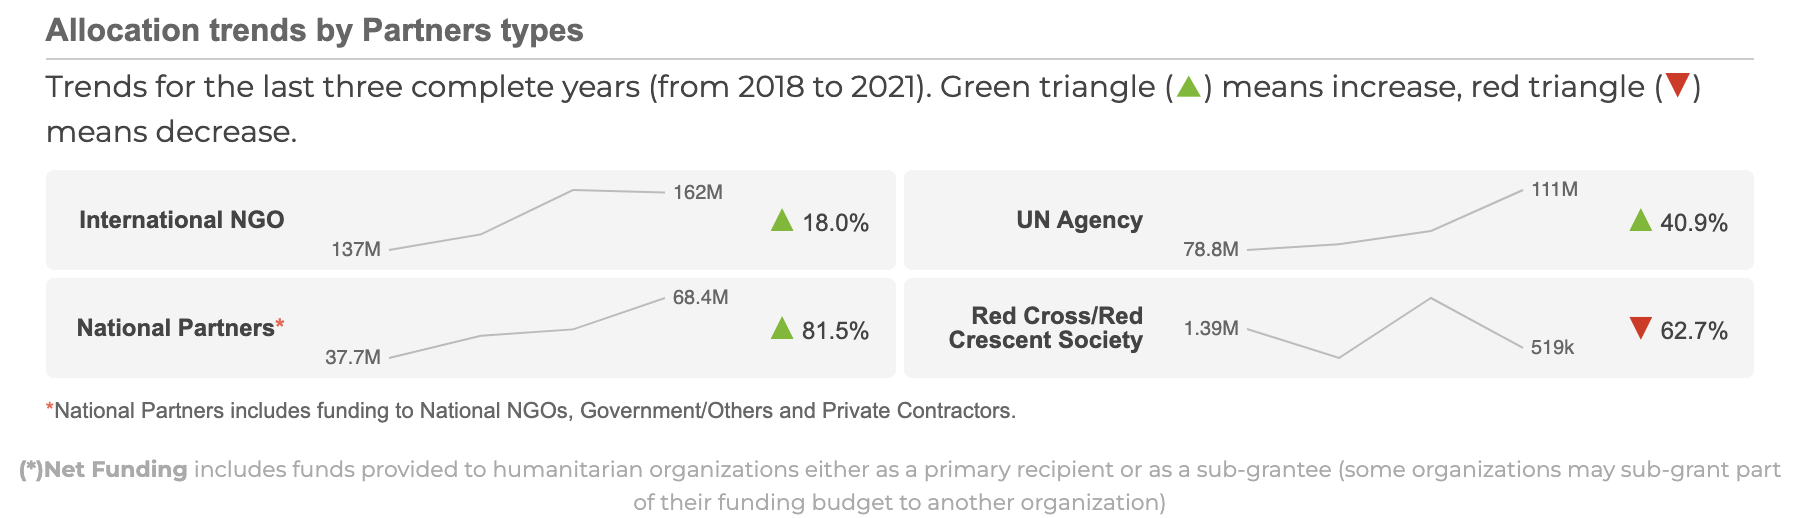
This section provides the breakdown of allocation trends per partner type, both Direct and Sub-Implementing Partners. It is calculated based on the last three years. A green arrow means the allocated amount increased over the last three years, while the red arrow represents a decrease in the allocated amount to partners. You can only apply a CBPF filter (i.e. select one or several CBPF in the filter section at the top) to this section.
|
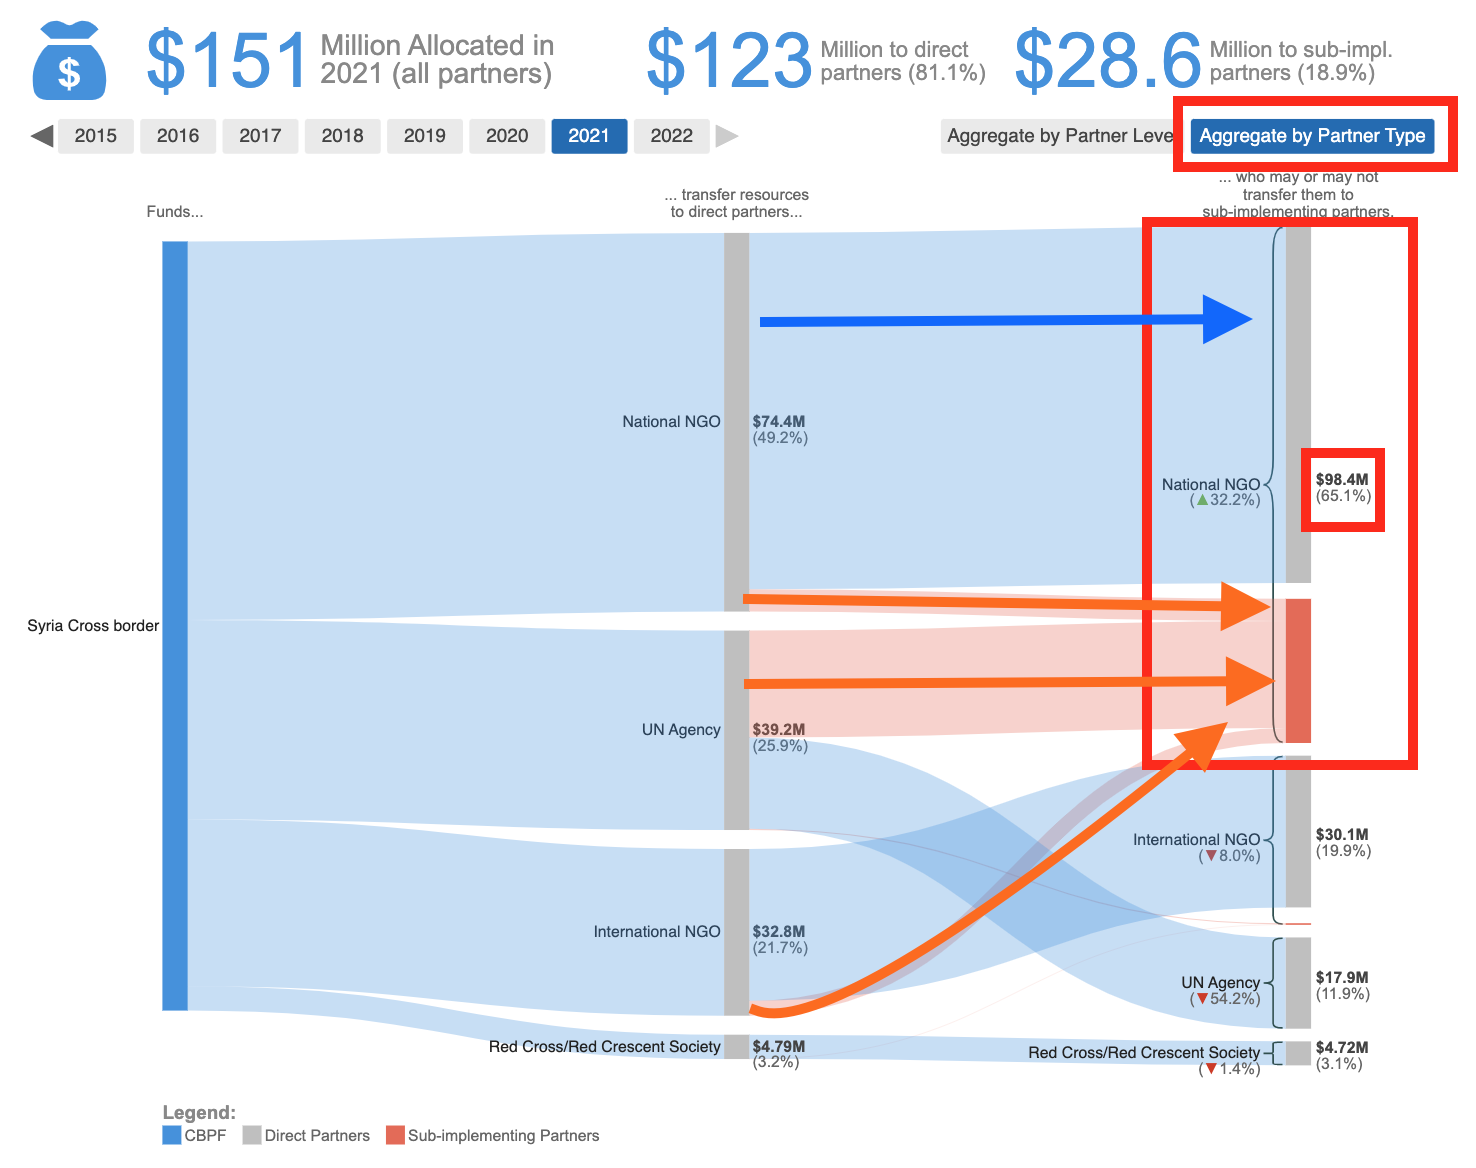
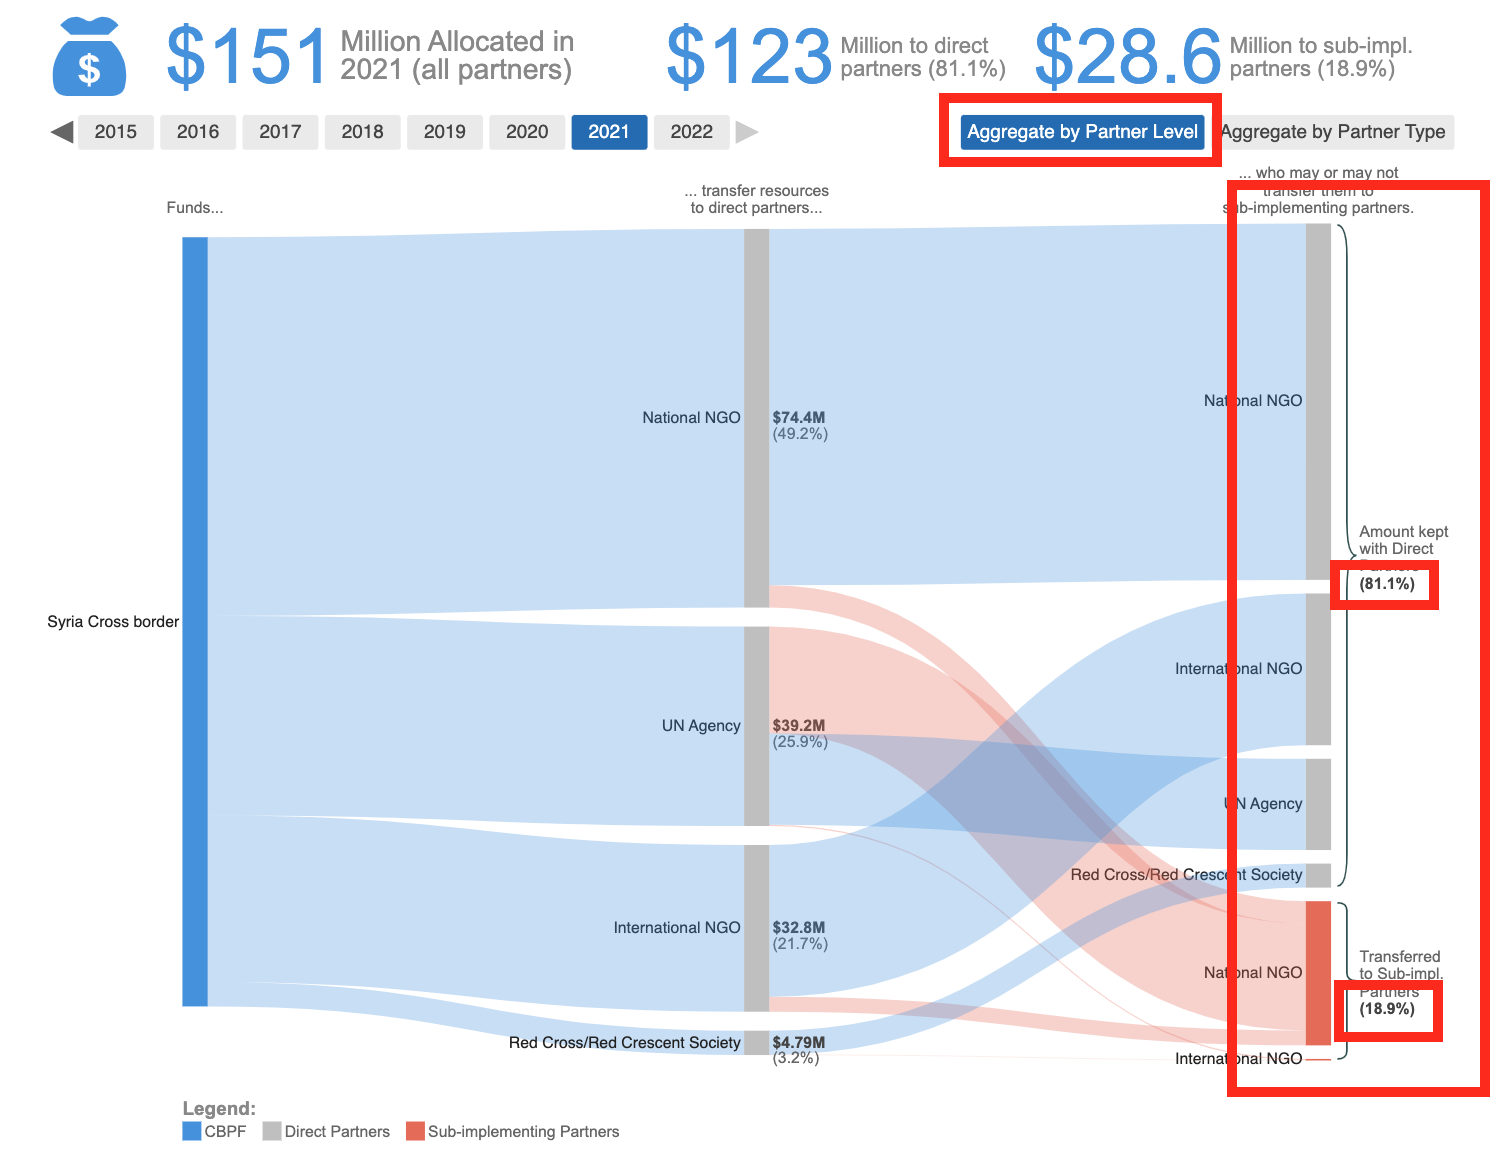
GMS Focus: Aggregate by Partner Level vs. Aggregate by Partner Type filters
This option allows users to see the proportion of grants and sub-grants per partner type in the third column of the alluvial diagram. For instance, in the screenshot below, we can see that National NGOs received most of their funding by being Direct Partner (blue flow). However, we can also see that National NGOs received sub-grants from UN Agencies, International NGOs and National NGOs (orange flows). Overall, as both a Direct Partner and as a Sub-Implementing Partner, the National NGOs were the primary recipients of CBPF funding (65,1%).
This option will divide the third column into two: the Direct Implementing Partners, in grey and the Sub-Implementing Partners, in orange. This allows for a clear view of the amount/proportion of funding that was kept as direct grant by the Direct Implementing Partner (in the screenshot below, 81,1%) and the amount that was sub-granted to Sub-Implementing Partners, (in the screenshot below, 18,9%).
|
IV) How to access more precise data, including the exact allocated amounts?
The infographic includes multiple tooltips and ribbons, providing additional information. To access the tooltips, hover over the alluvial diagram elements, namely:
- On one CBPF in the first column.
- On one Partner type in the second column.
- On one Partner type, or partner level in the third column.
- On the blue and orange flows.
When you hover over an element (in the example in the screenshot below, Somalia CBPF), it singles its data out, while setting the other parameters (i.e. the other fund’s data) in the background.