I) What are the different components of the infographic?
II) How to access the data?
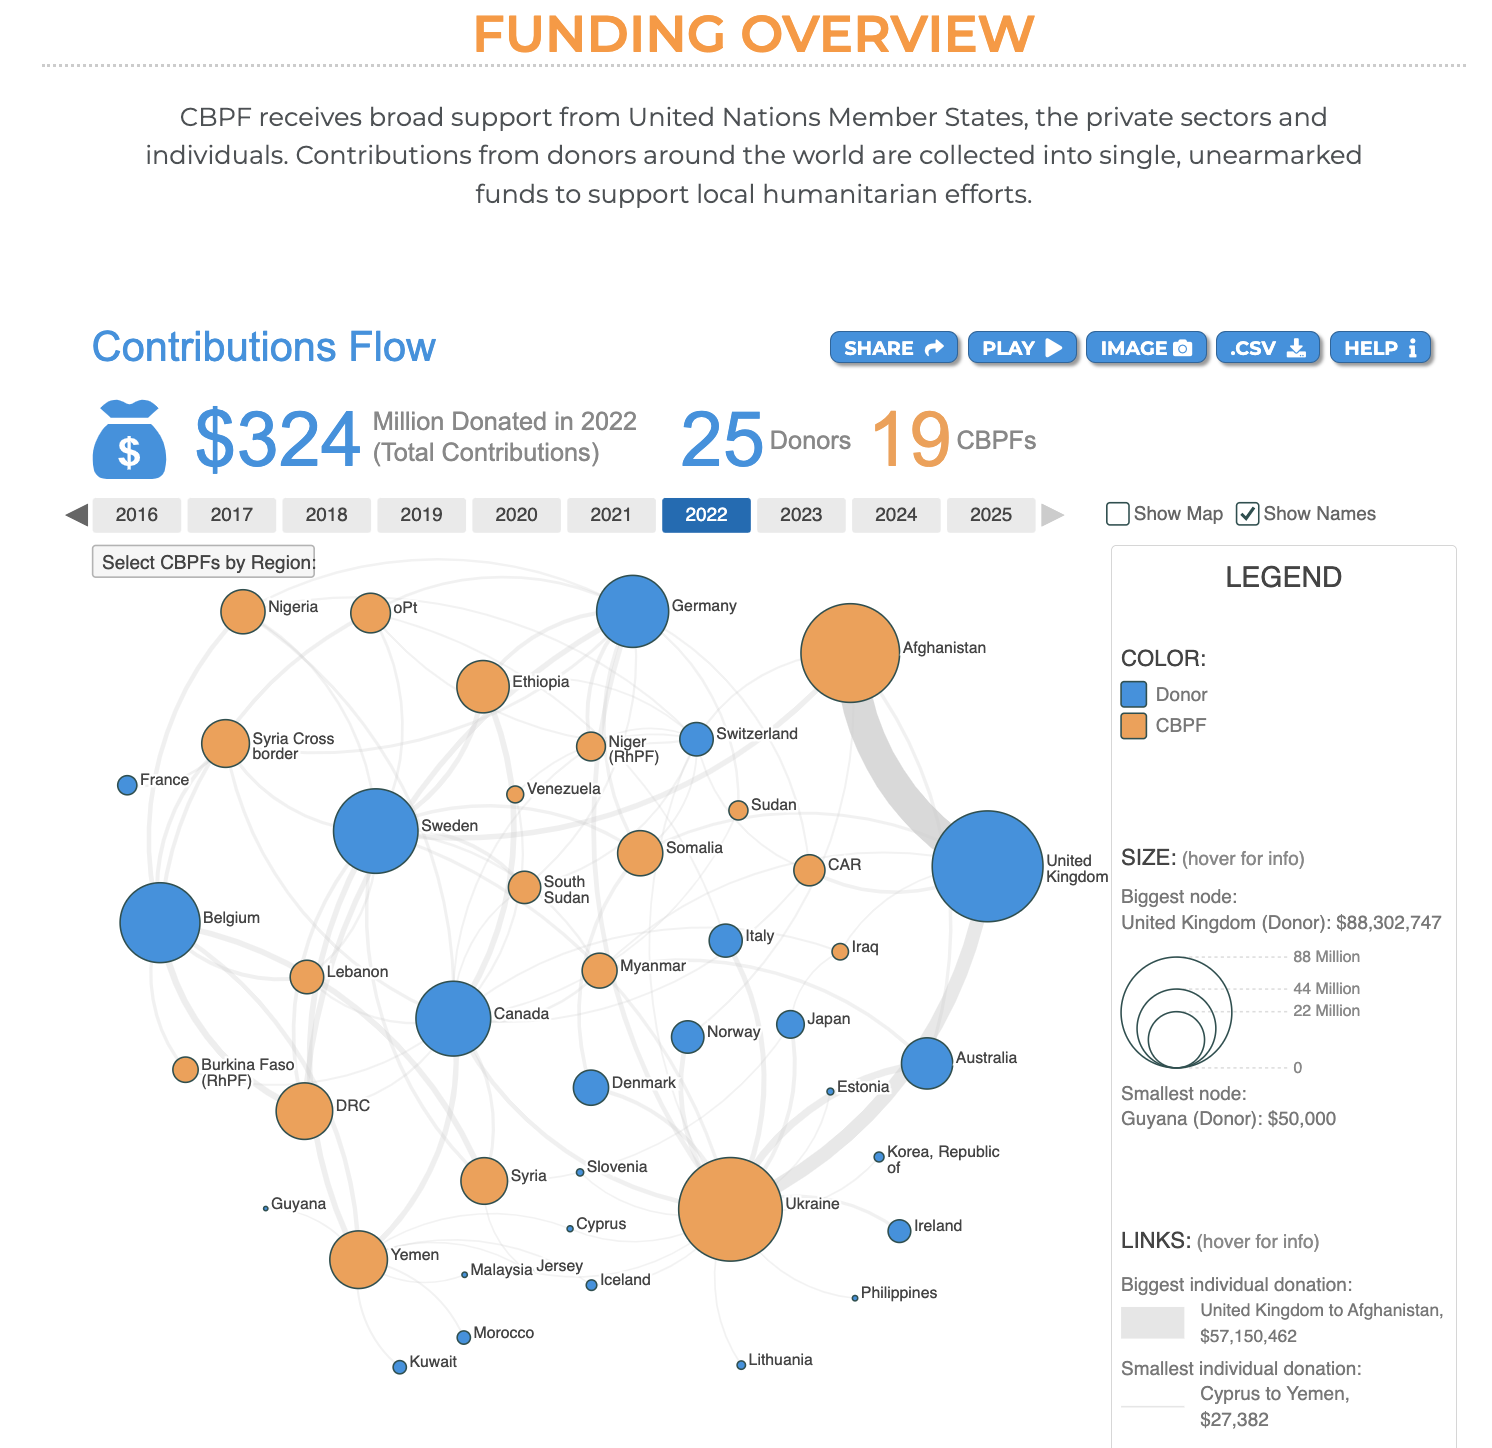
This visual focuses on funding flows and trends.
The blue circles represent the donors, while the orange circles represent the CBPFs. The size of the circles corresponds to the size of contributions for donors, and funding received for CBPFs. Users can select a donor to see the amount contributed to each CBPF accordingly; or select a CBPF to track its according donors.
I) What are the different components of the infographic?
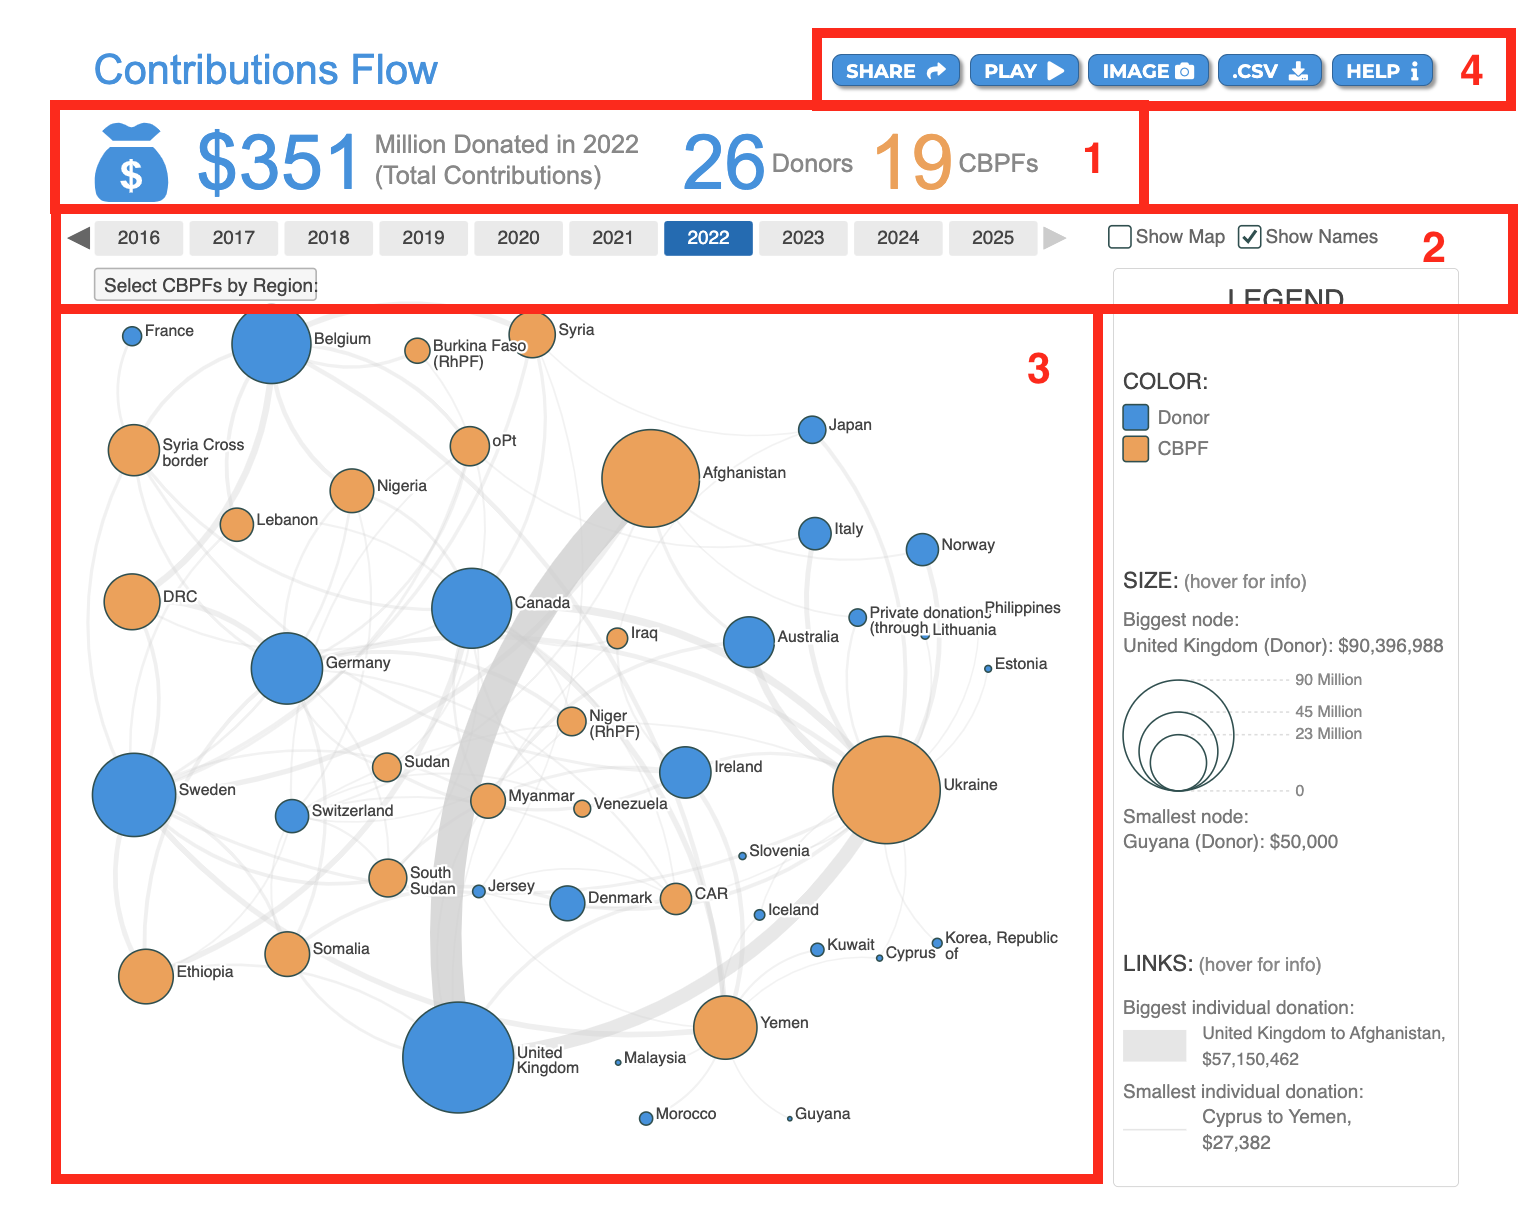
Please see below the description of fields 1-4 as annotated in red in the screenshot above.
-
The Allocations’ key figures: they reflect the filters applied, and give the following information:
a. The total contributions received in USD.
b. The number of donors.
c. The number of CBPFs. -
The filters option: users can apply these filters to personalize the data.
a. Year: users can select one year by clicking on it, or multiple years by double-clicking on them.
b. Map and names display: users can select the “Show Names” option to display the country’s name next to each circle, tick the “Show Map” option to show the circles in their corresponding geographic coordinates, or select both.
c. Select CBPF by region: users can hover over this button to see and select the region(s). -
The proportional circle graph: represents the contributions given by donors (blue circles) and received by CBPFs (orange circles). The size of each circle indicates the amount donated/received.
-
The usual CBPF Data Hub tooltips: Share, Play, Image, .CVS and Help. To know more about these tooltips, please click here.
The Funding Overview visualisation provides data at three levels:
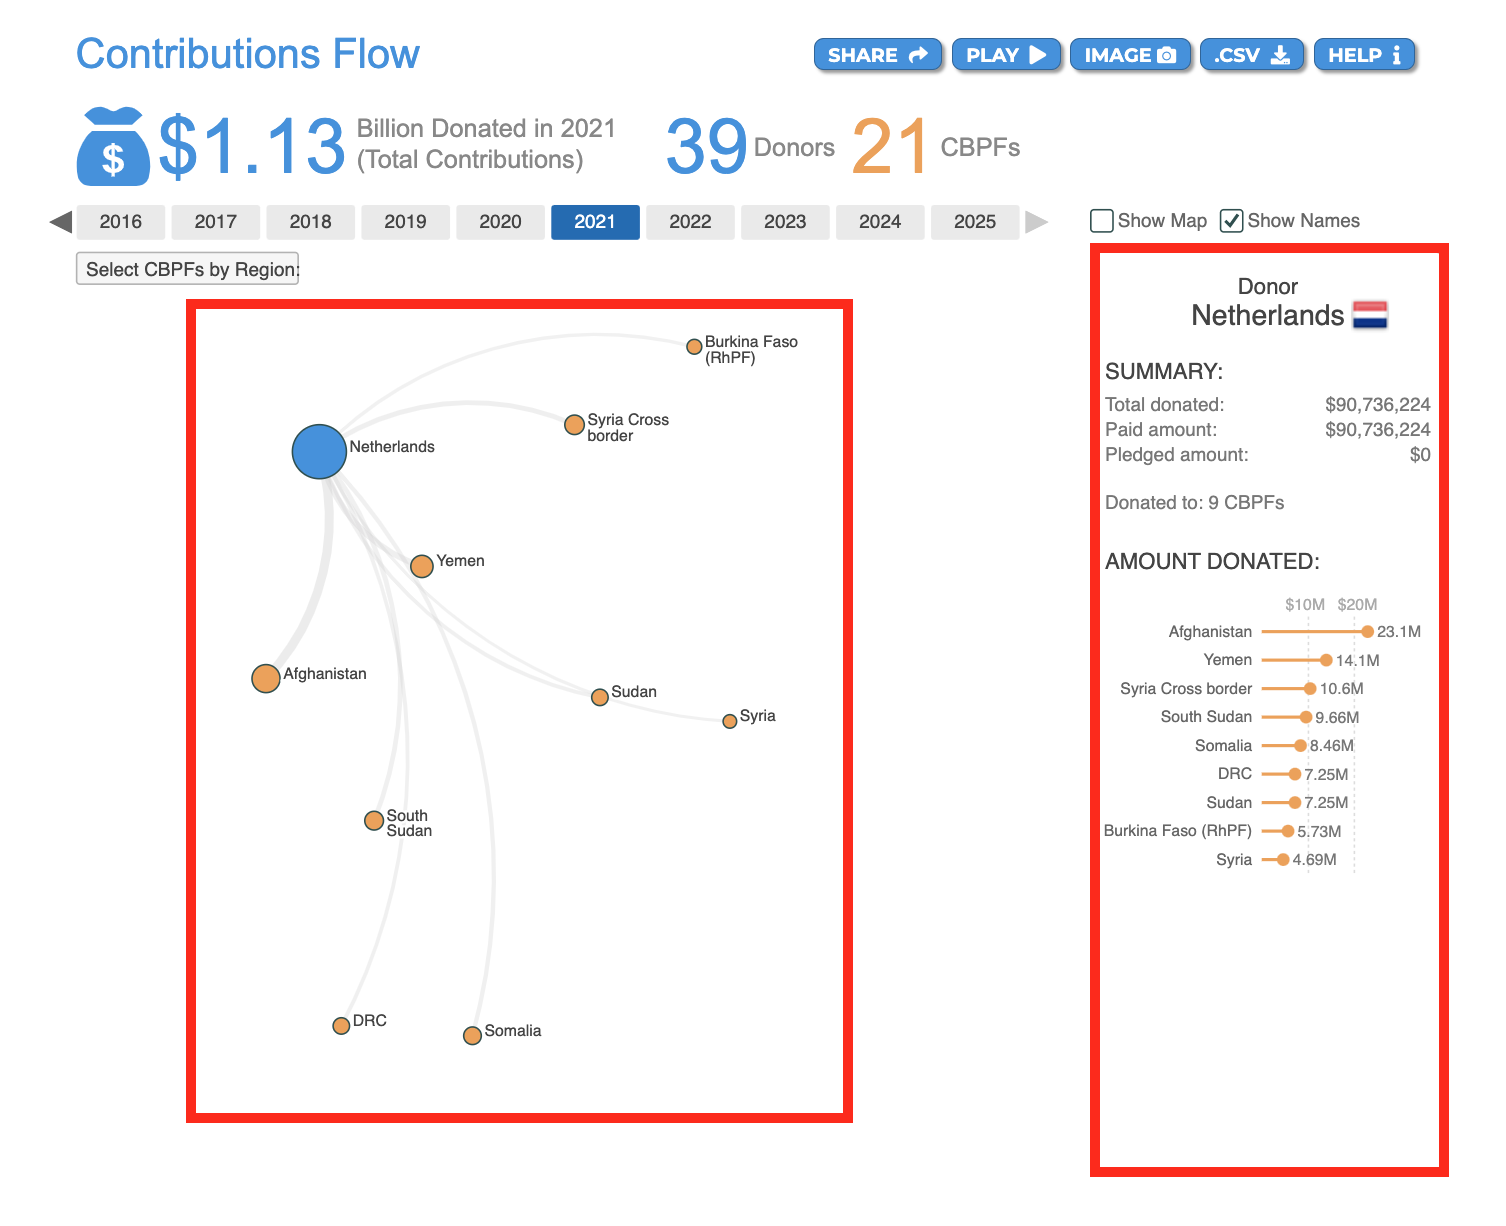
1. The contributions allocated by donors
Hover over a donor’s node to display the following information:
- Total amount donated for the selected year(s) in USD.
- Total amount paid for the selected year(s) in USD.
- The pledged amount for the selected year(s) in USD.
- The number of CBPFs the donor contributed to.
- The amount in USD donated for each fund.
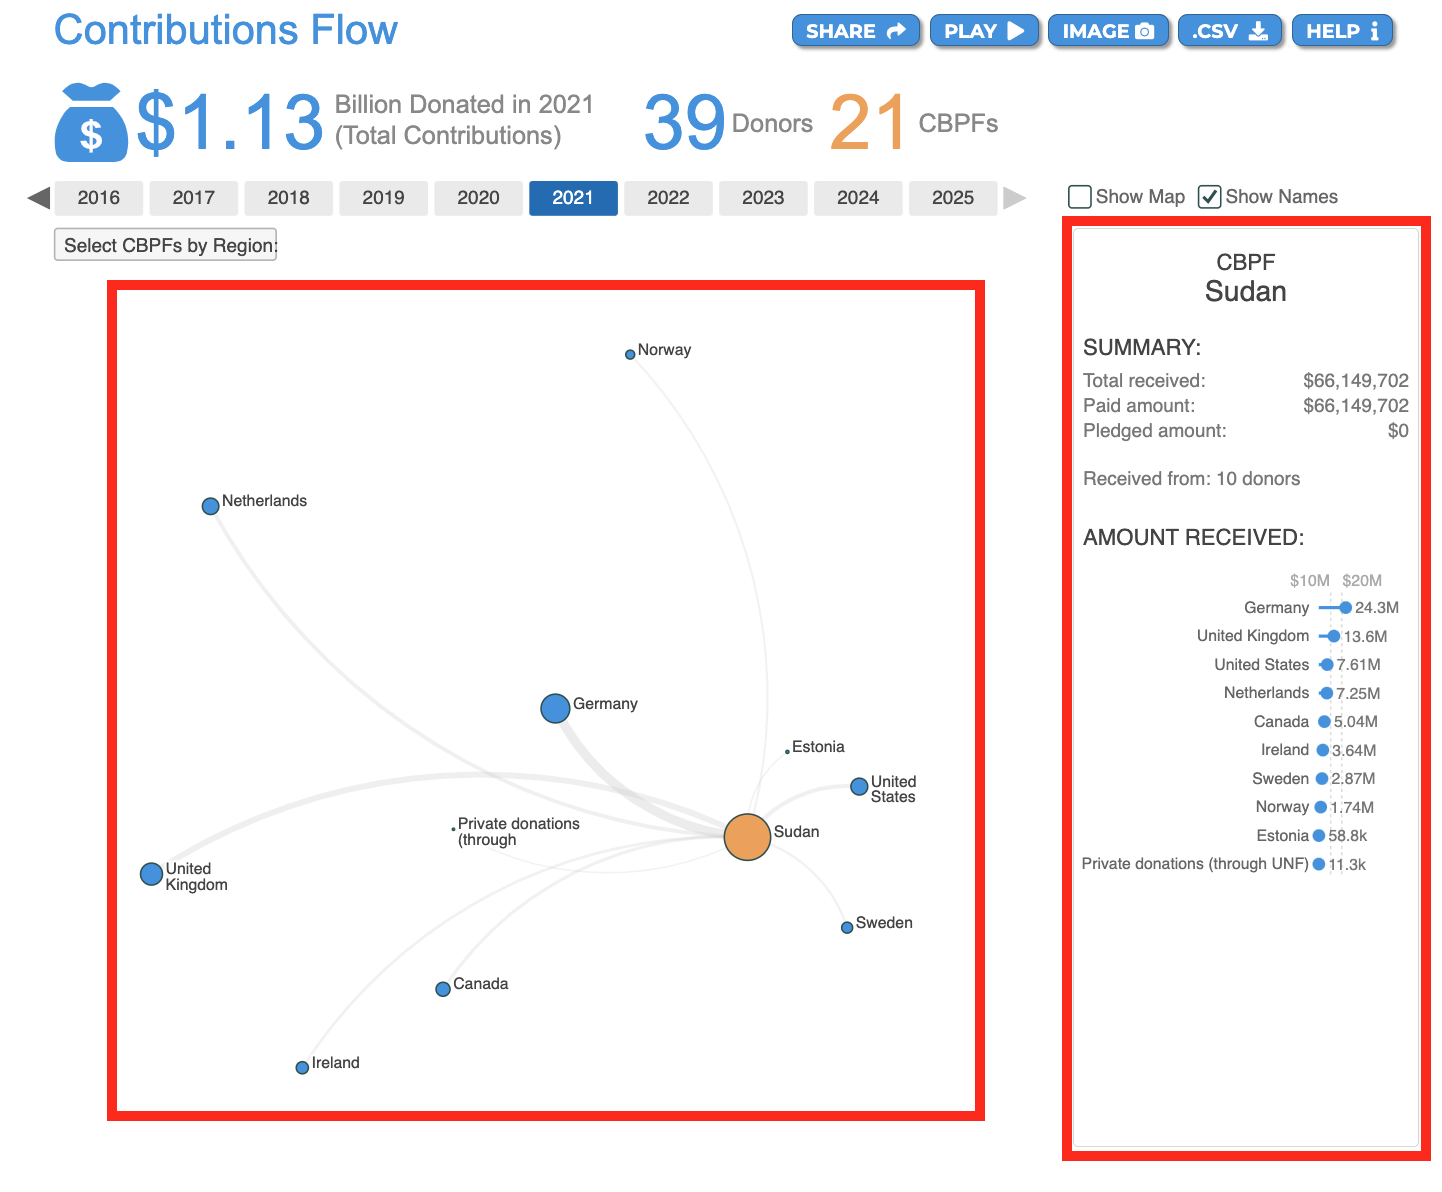
2. The contributions received by CBPFs
Hover over a CBPF’s node to display the following information:
- The total amount received by the fund for the selected year(s) in USD.
- The total paid amount to the fund for the selected year(s) in USD.
- The pledged amount to the fund for the selected year(s) in USD.
- The number of donors who contributed to the fund.
- The amount in USD received from each donor.
3. Global information
The legend square provides a global explanation of the Contribution Flows visualisation when no nodes are selected.
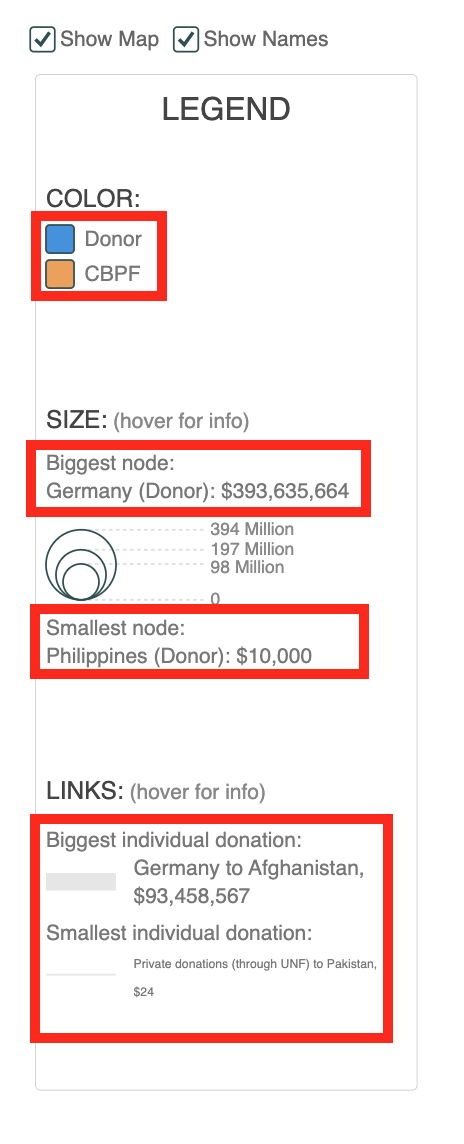
- Hover over “Donor” or “CBPF” to display the Donors circles only or the CBPFs circles only.
- Hover over the “Biggest node” to display the biggest node only.
- Hover over the “Smallest node” to display the smallest node only.
- Hover over the “Biggest individual donation” to display the biggest donation (from donor to CBPF).
- Hover over the “Smallest individual donation” to display the smallest donation (from donor to CBPF).