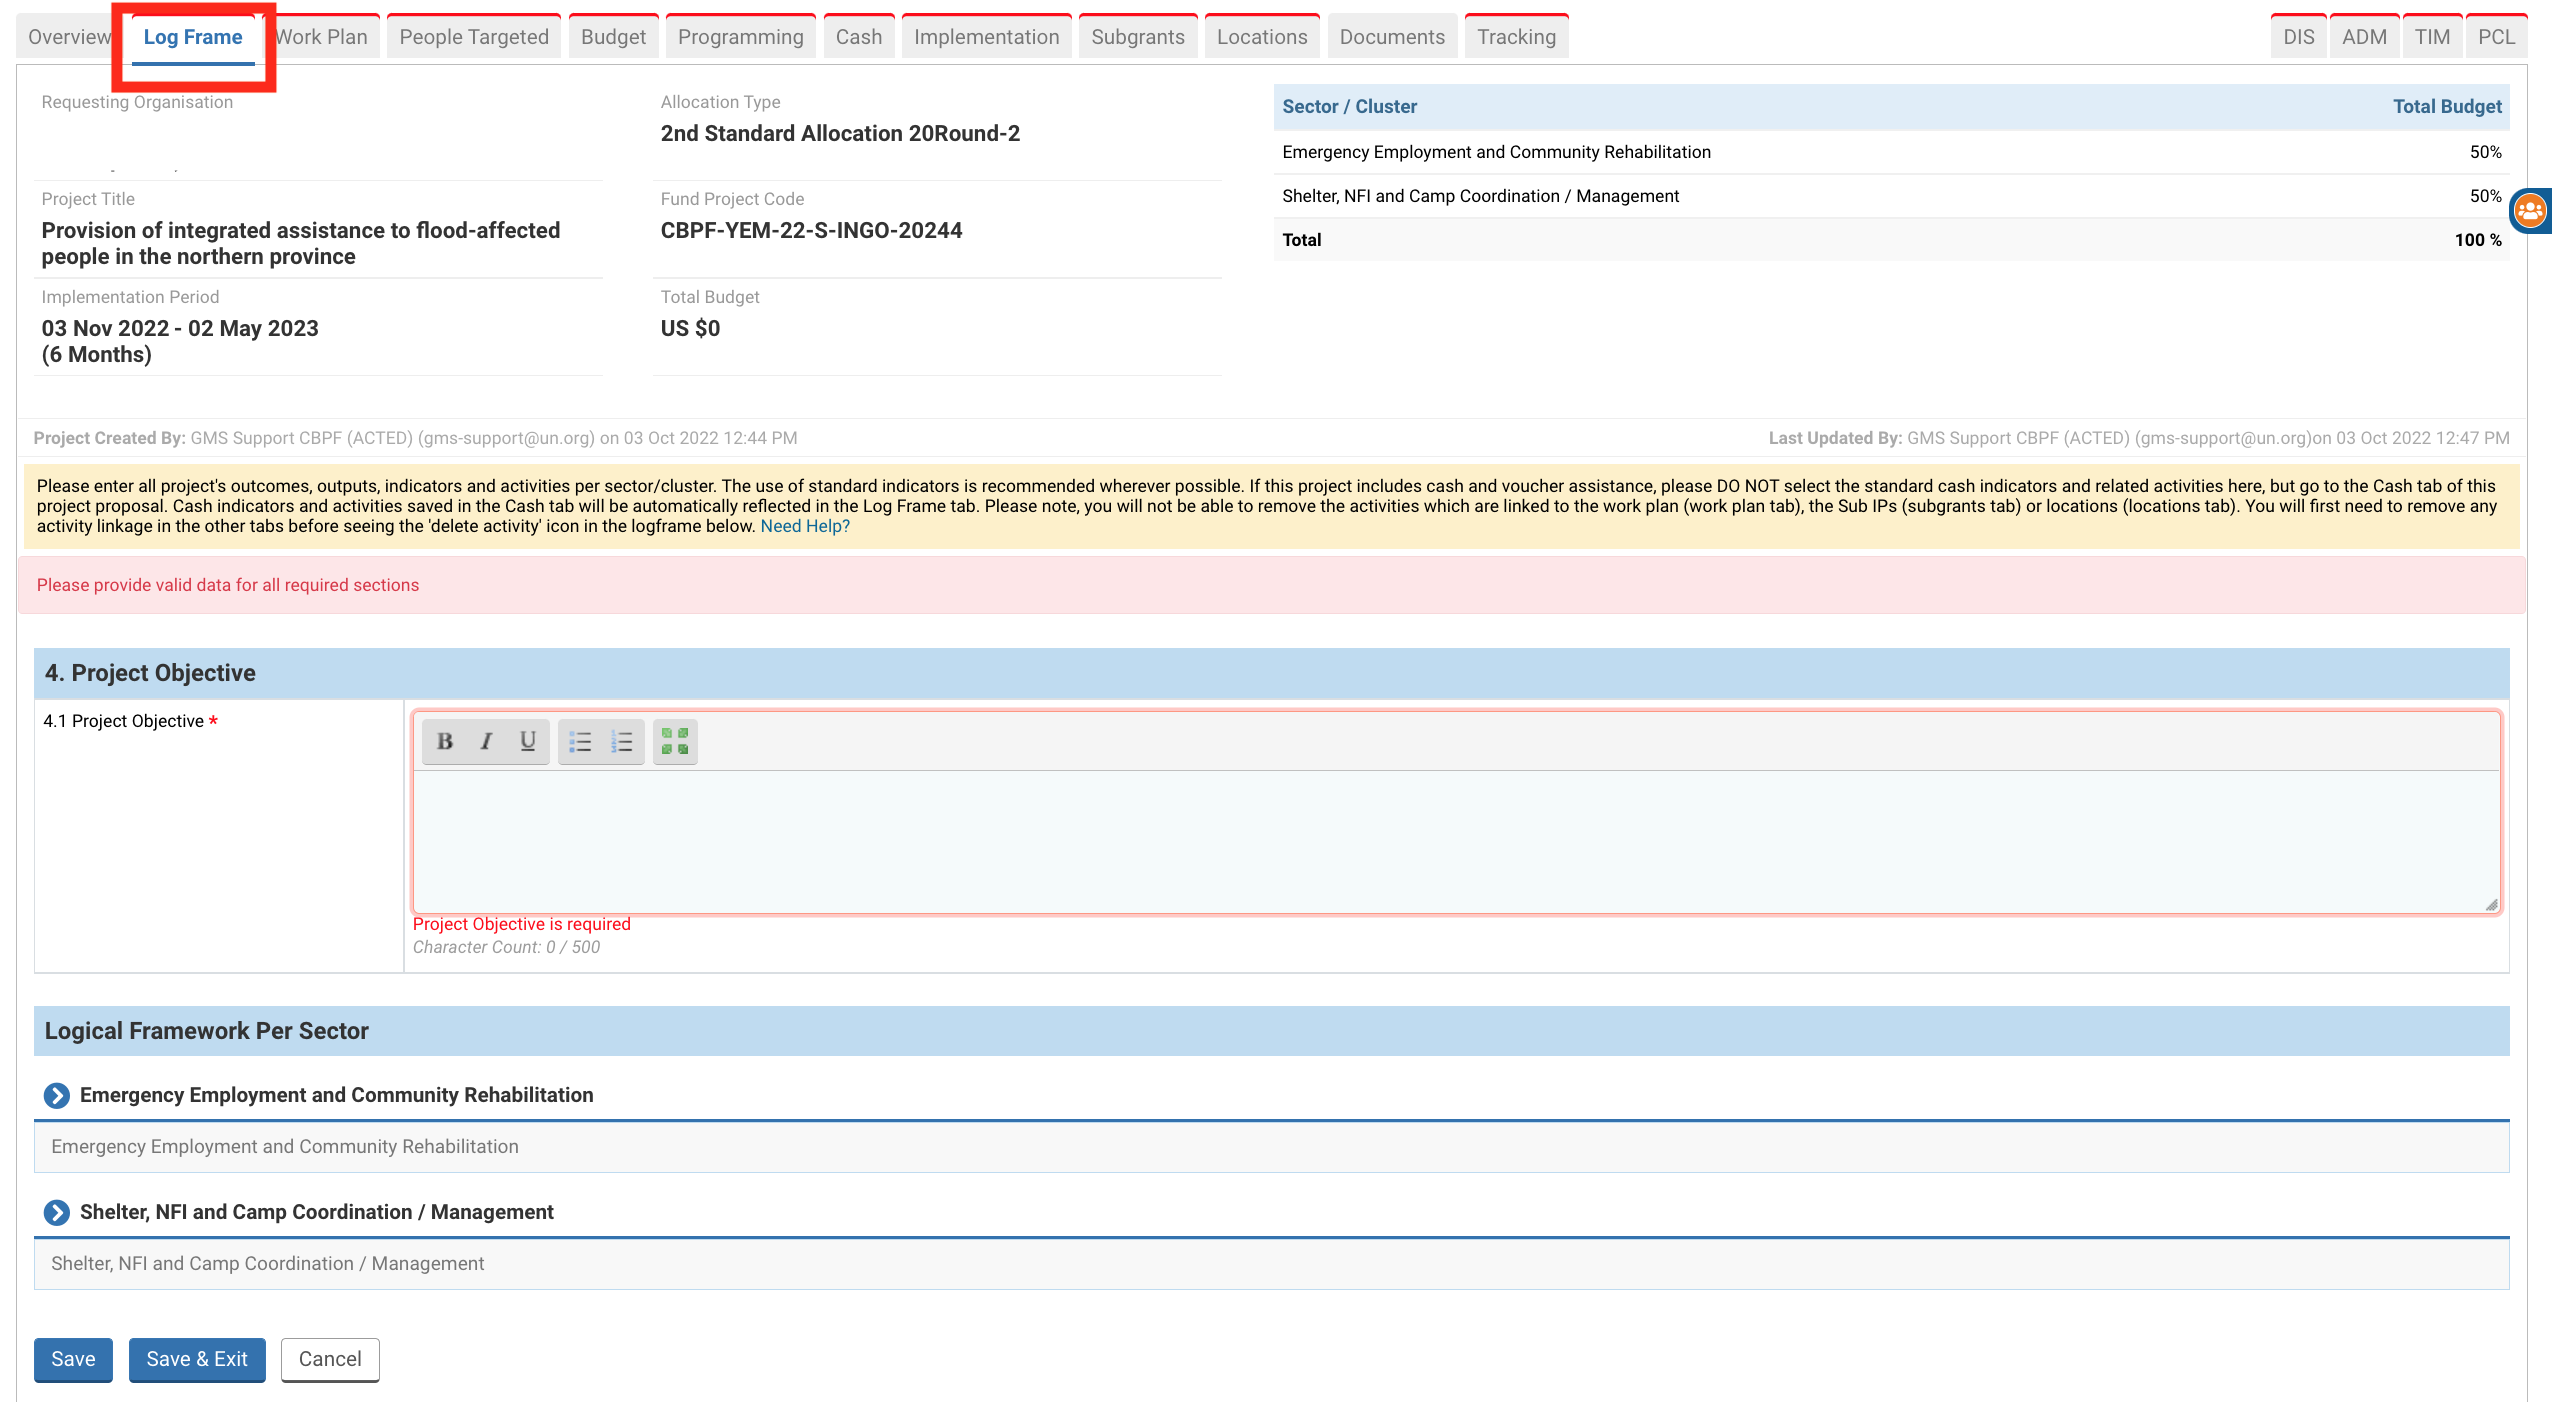
General features
Log Frame Workflow
4. Project objective
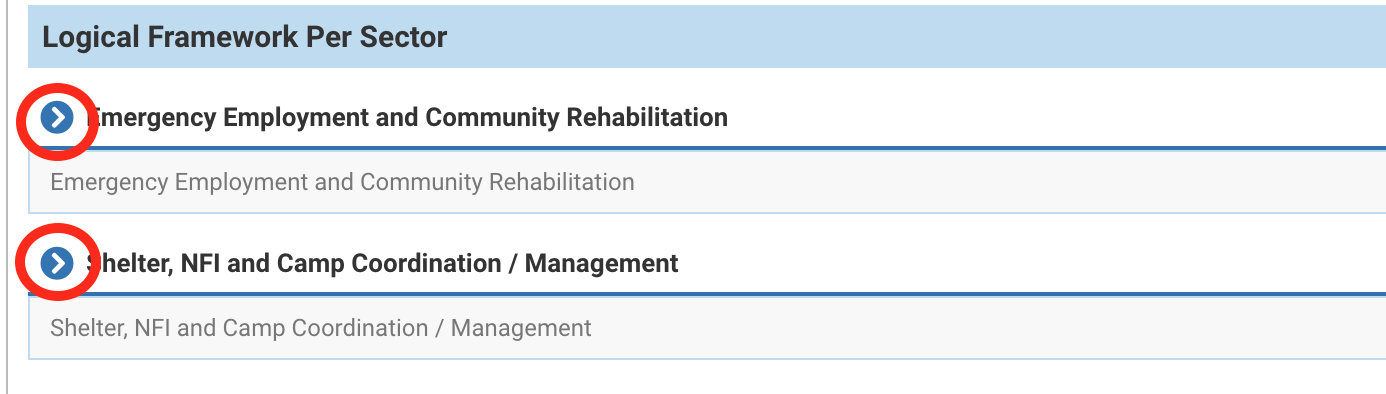
5. Logical Framework Per Sector
The user can indicate all project’s outcomes, outputs, indicators, and activities per cluster in the Log Frame tab. All fields marked by an asterisk * are mandatory.
Please note that all the data provided in the screenshots of this article is purely indicative.
Please note: if the project includes cash and voucher assistance, please DO NOT select the standard cash indicators and related activities here but go to the 'Cash' tab of your project proposal. Cash indicators and activities saved in the 'Cash' tab will be automatically reflected in the 'Log Frame' tab.
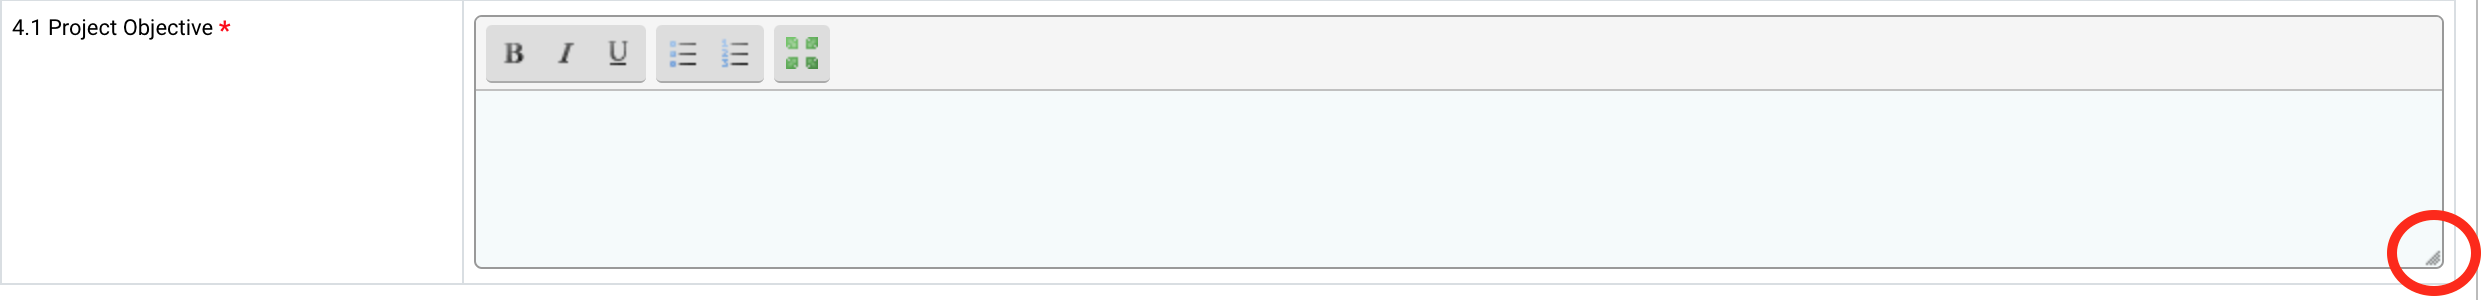
- You can expand or reduce the narrative box by moving the bottom right corner of the box.
- You can click on these arrows to fold/unfold the section .
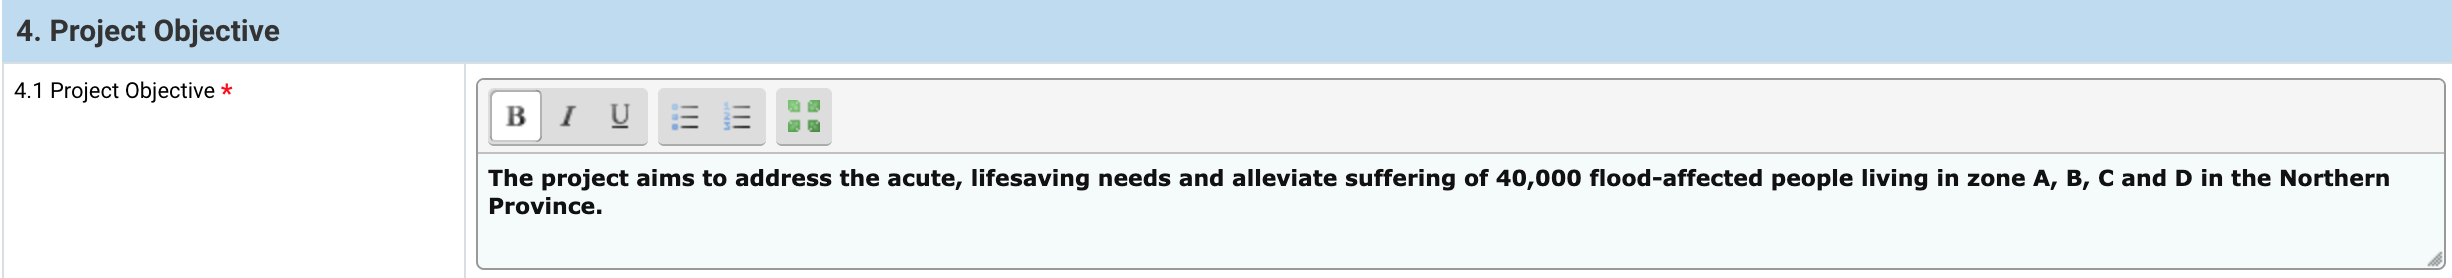
4.1 Project Objective *
Describe in this field the overall objective(s) to be achieved through the project.
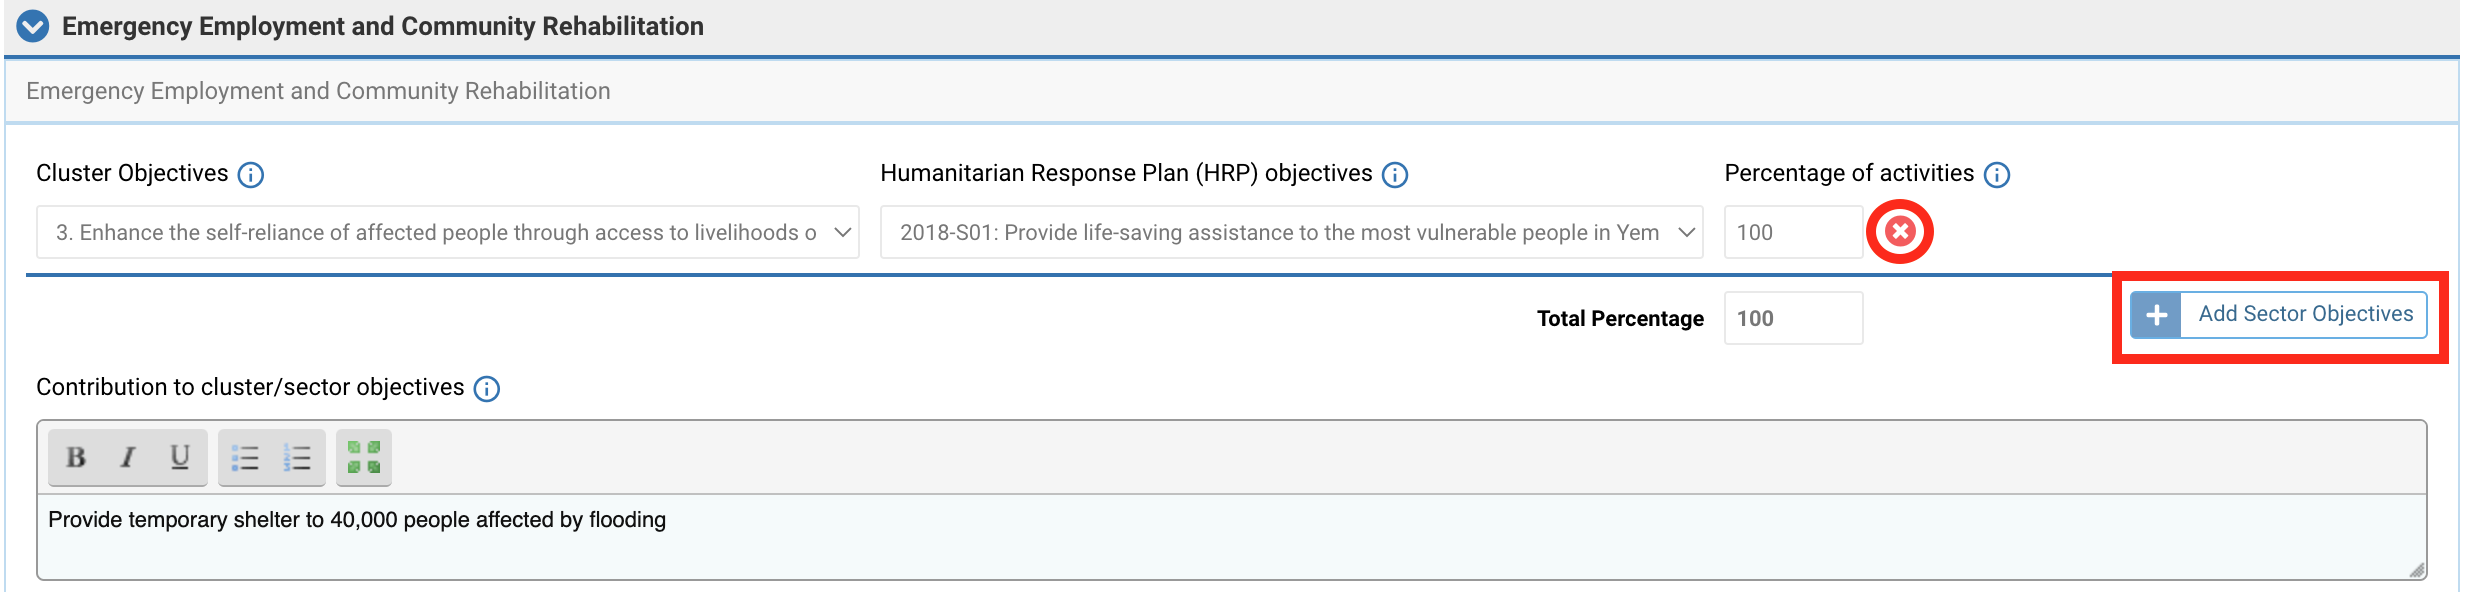
5. Logical Framework Per Sector
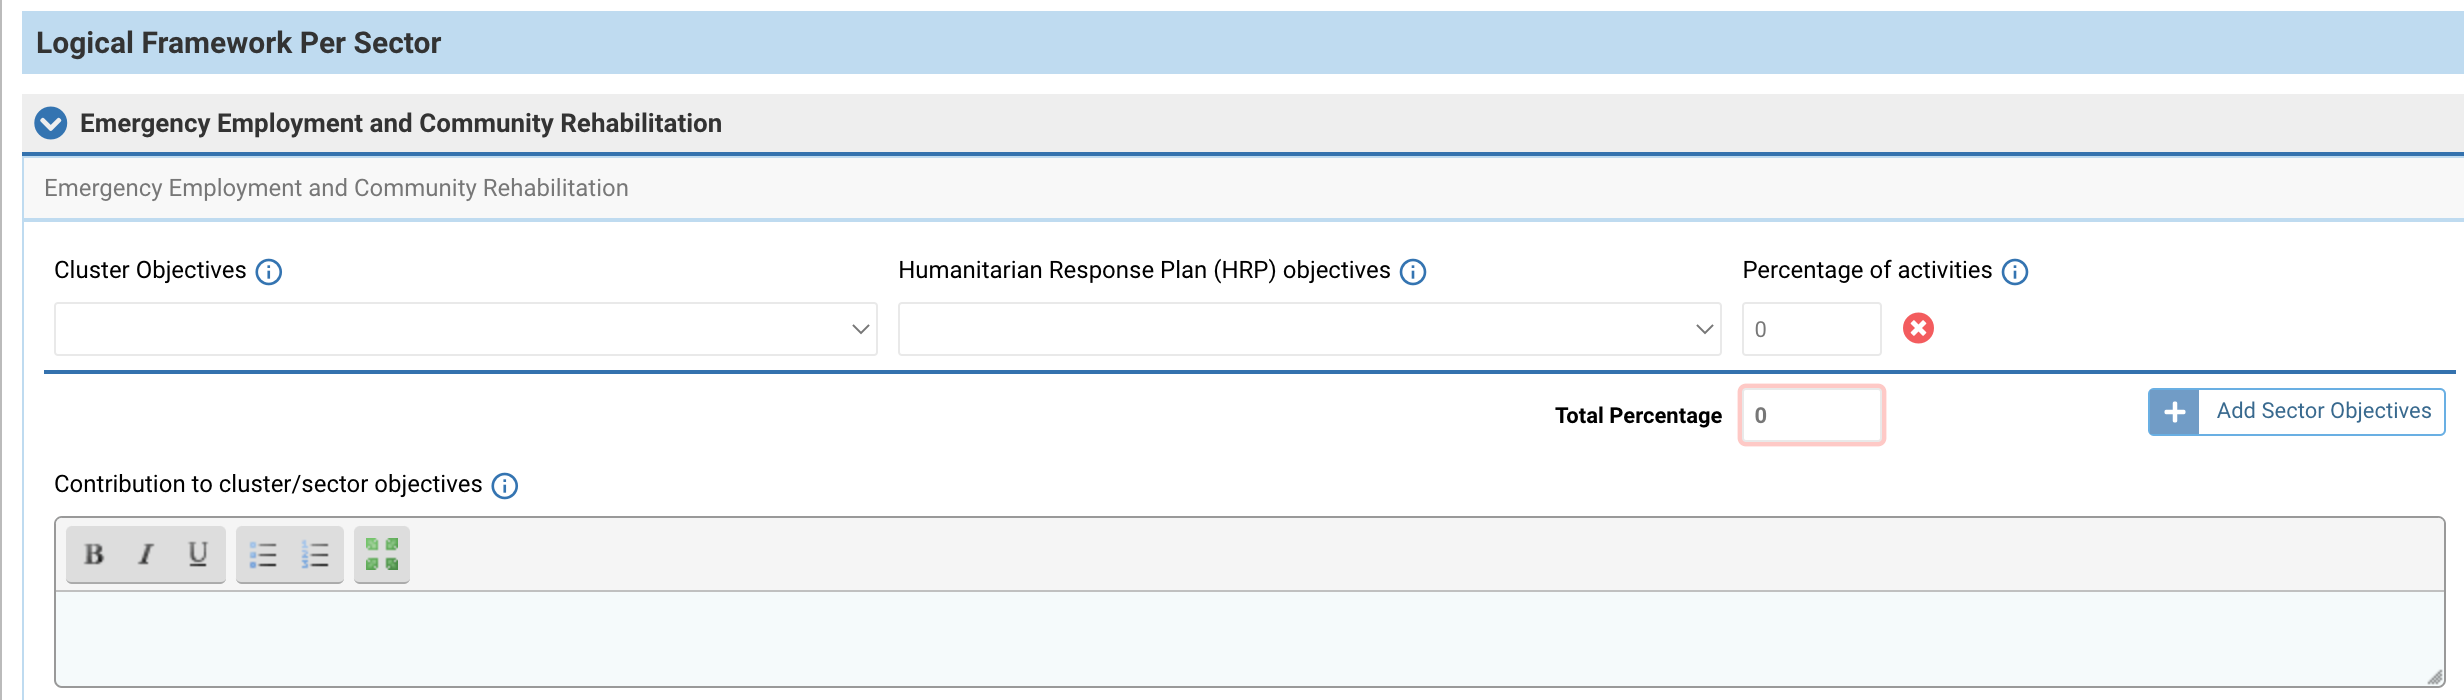
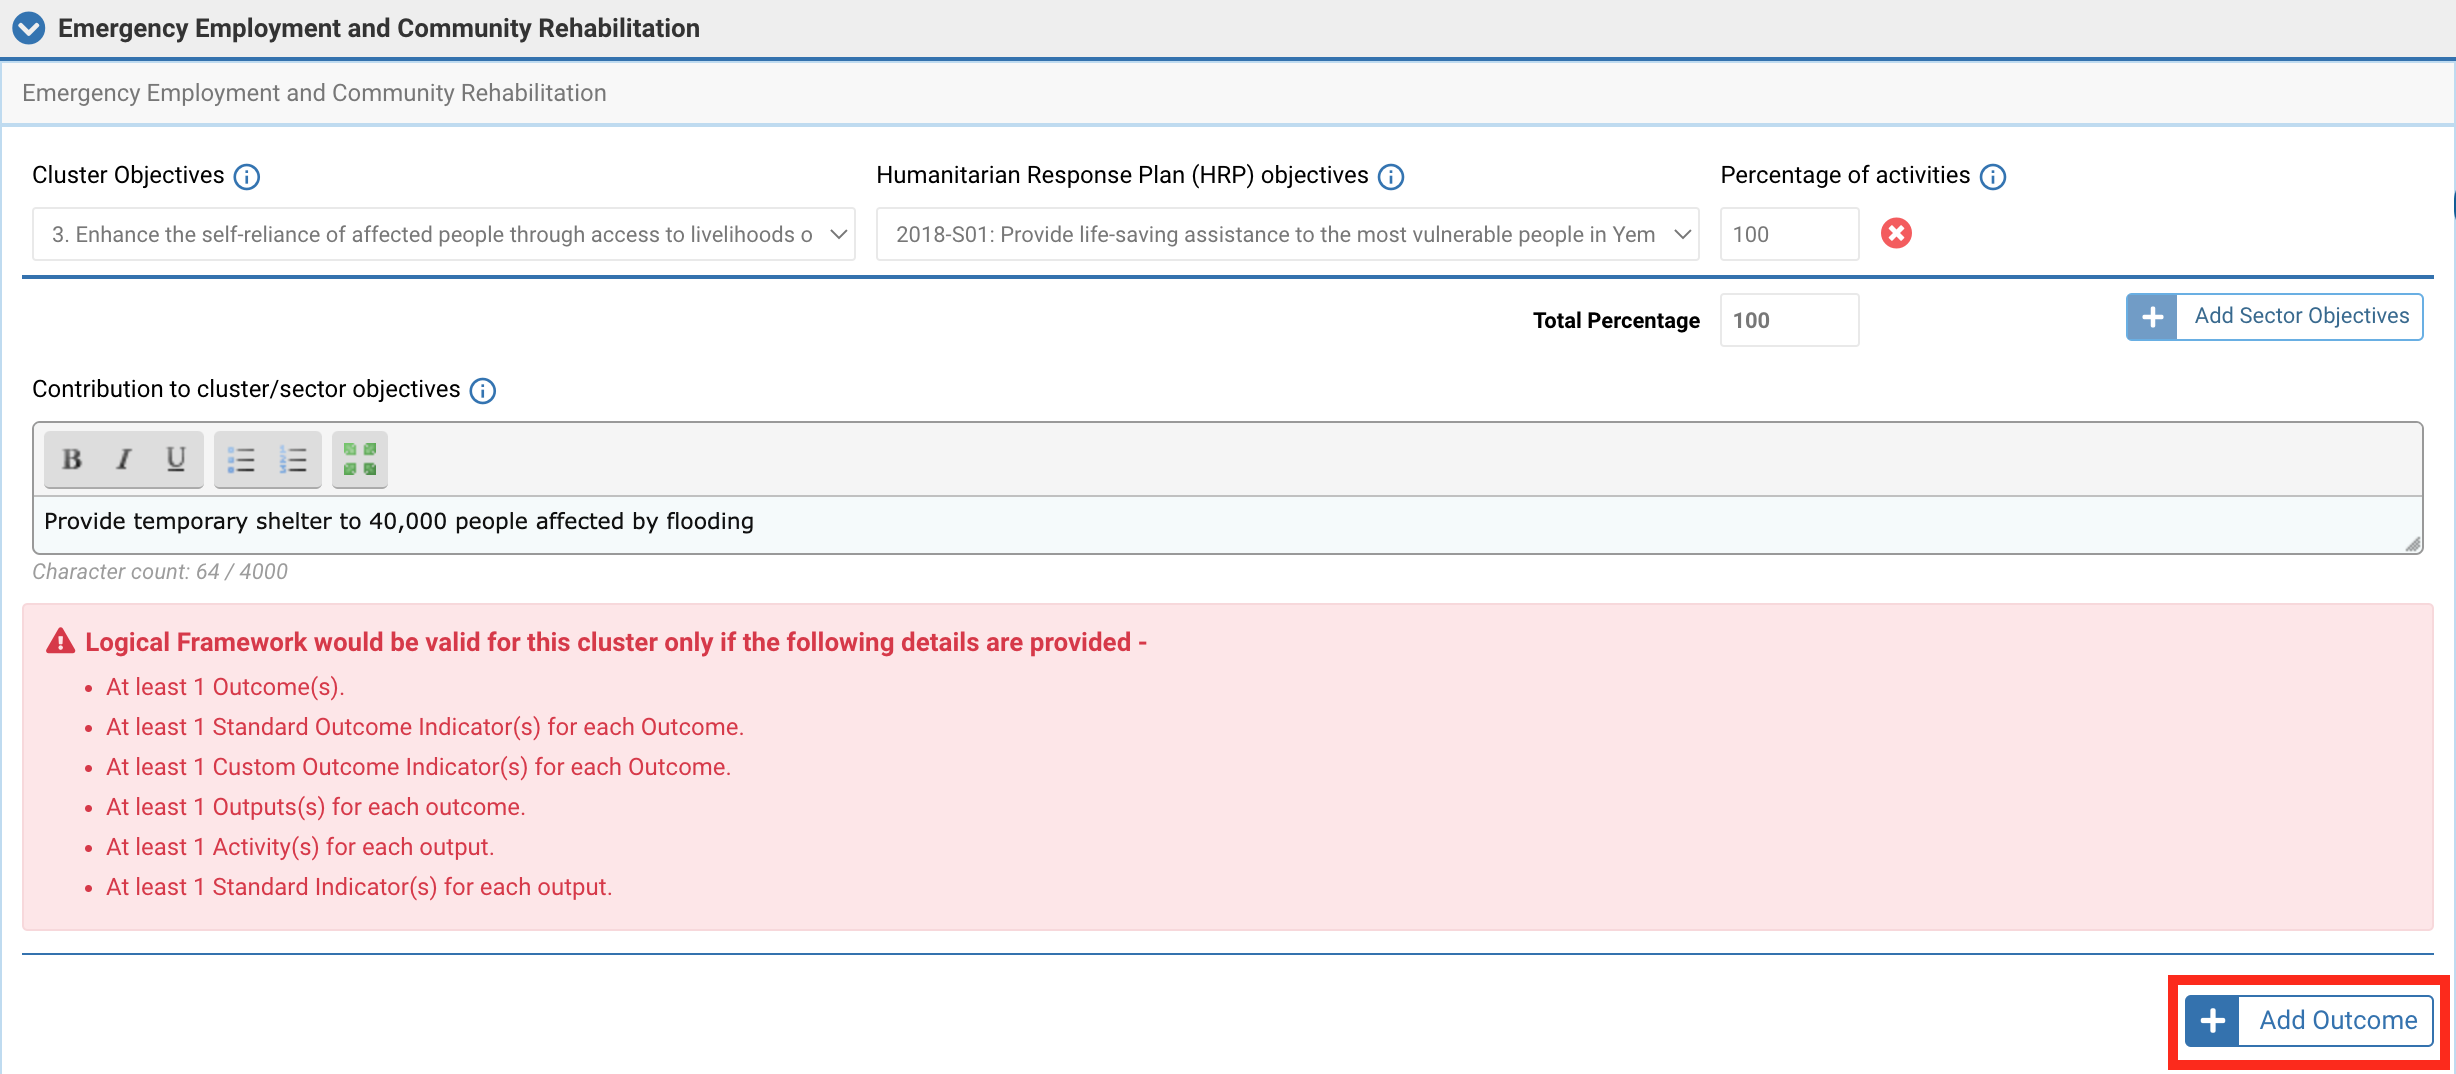
a. Add at least one Cluster Objective and one Strategic Response linked to each cluster as defined by the Humanitarian Response Plan. To do so, select the Cluster Objectives and the Strategic Response from each drop-down list, and add the percentage of activities accordingly. To add a new Cluster Objective, click on [Add Sector Objectives].
Please note: the total percentage of activities must be 100%.
Then explain in the narrative box the project’s contribution to the Cluster Objective(s).
You can delete a sector objective line by clicking on ![]()
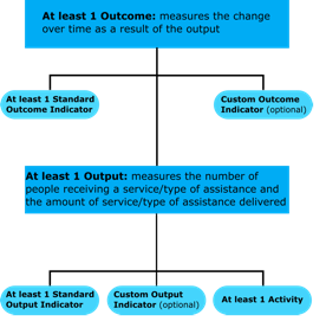
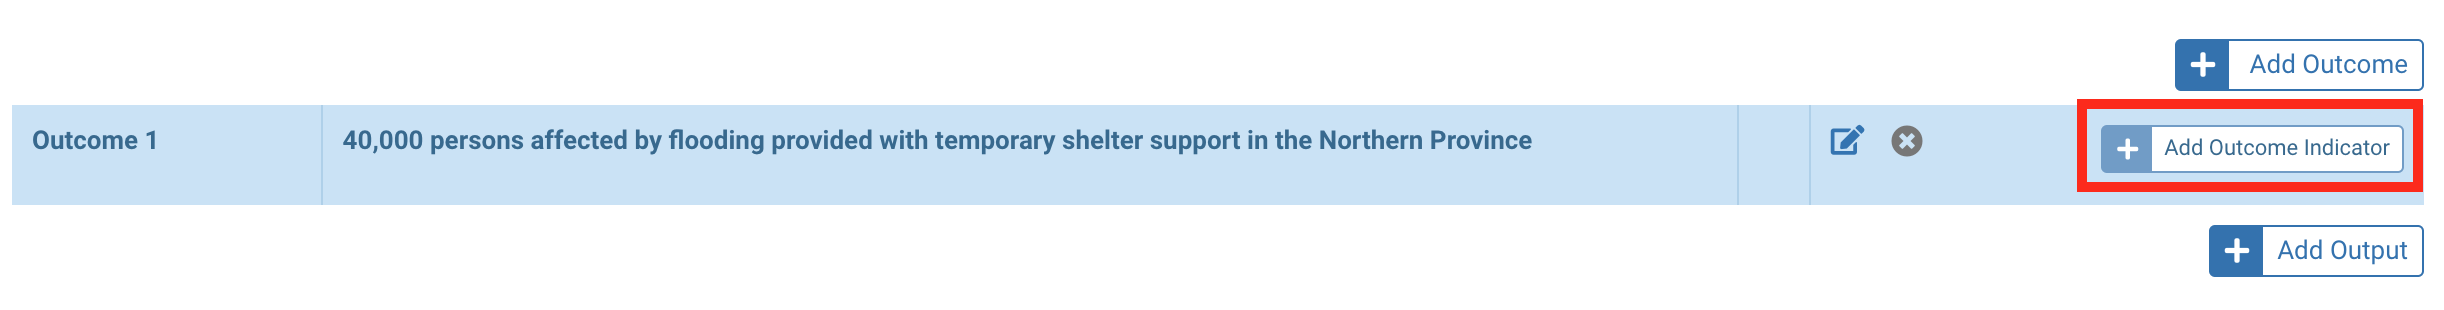
b. To add an outcome, click on [Add Outcome].
Please note: the outcome measures the changes over time as a result of the output (e.g., the change in the percentage of households with an acceptable food consumption).
Describe the outcome in the narrative field of the pop-up window and click on [Save] to save the outcome.

You can click on this icon ![]() to edit the outcome or this icon
to edit the outcome or this icon ![]() to delete it.
to delete it.

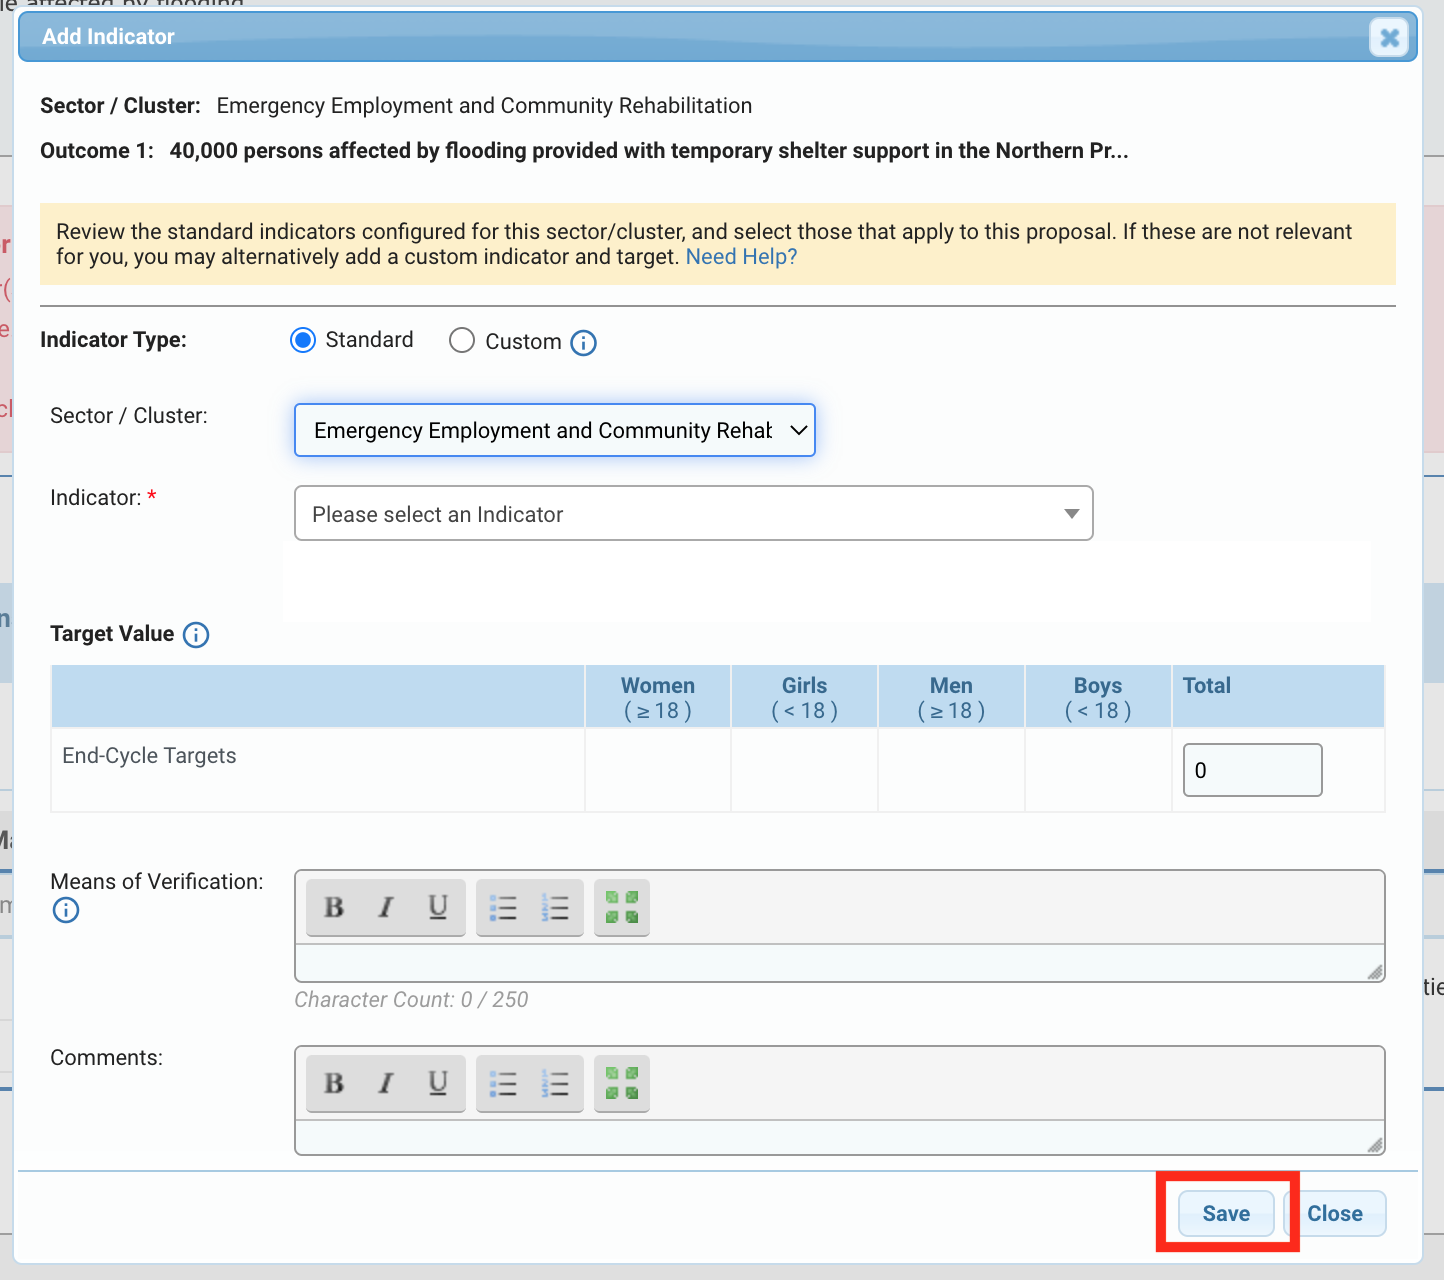
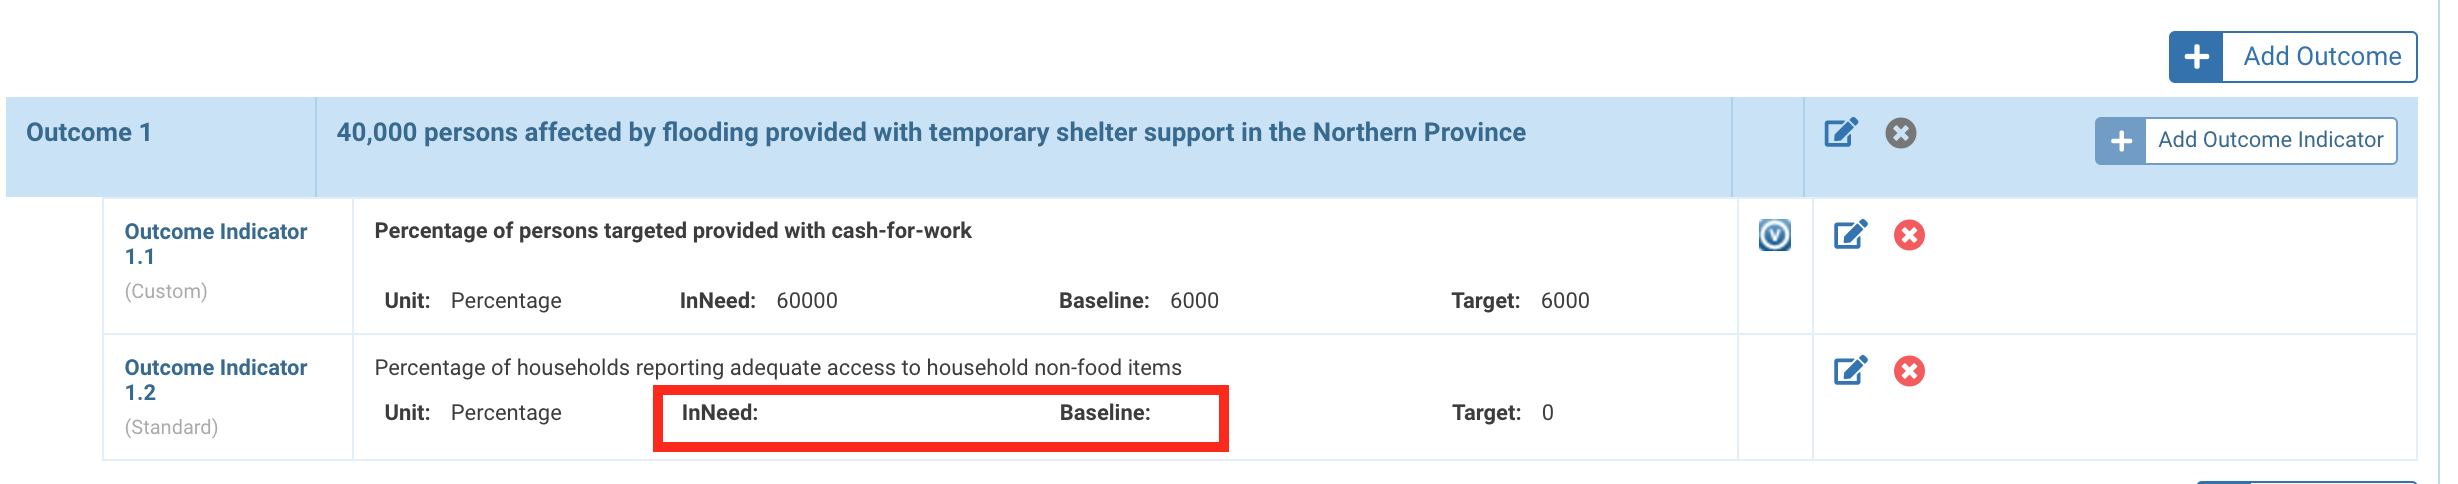
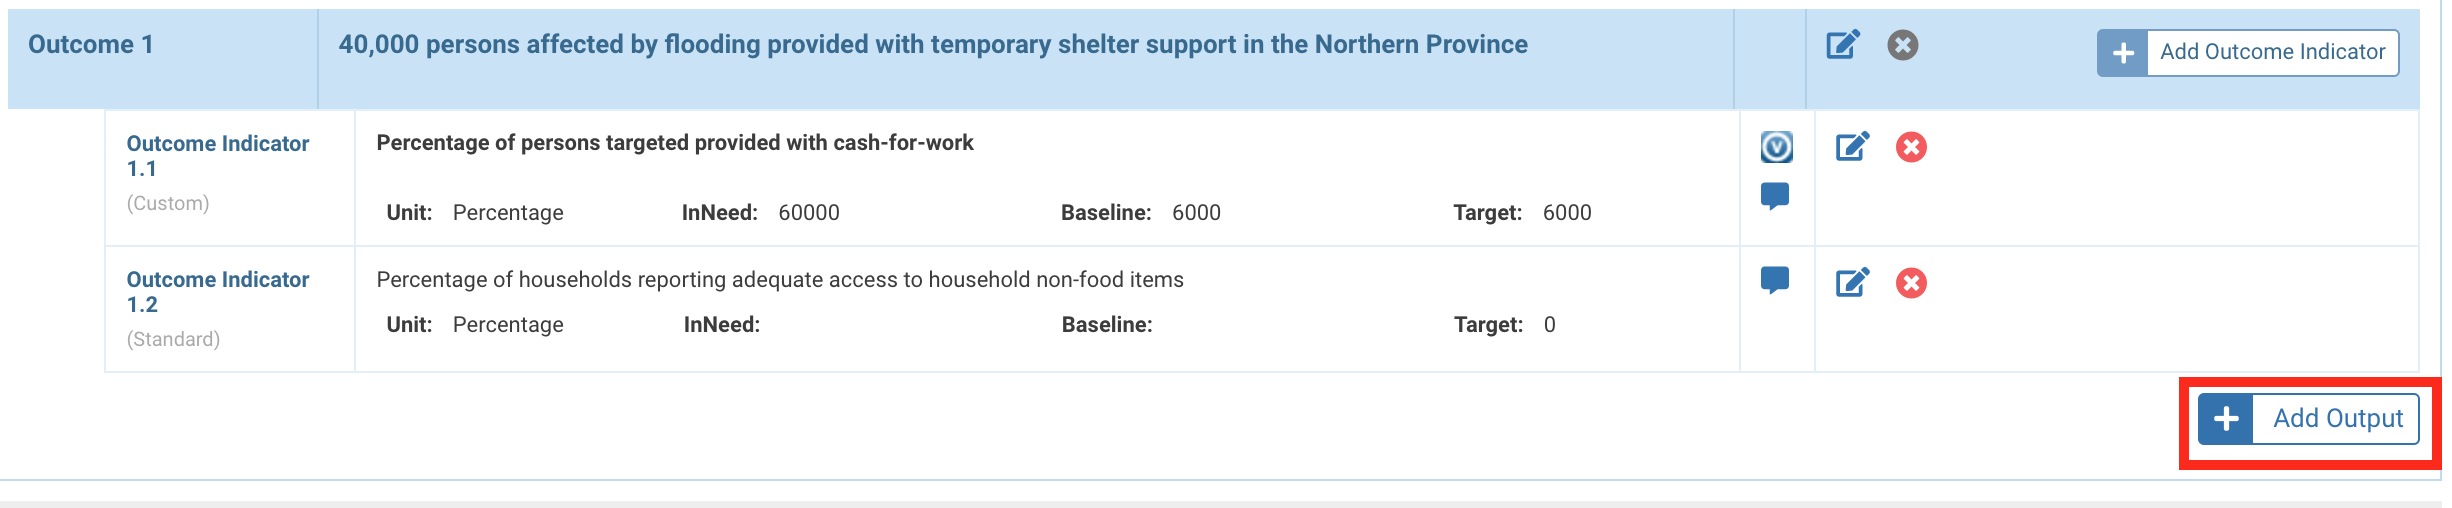
c. Add at least one Standard Outcome Indicator and add Custom indicators if necessary. To do so, click on [Add Outcome Indicator].
To add a Standard Outcome Indicator: once you have clicked on [Add Outcome Indicator], a pop-up window will appear. Fill in the Outcome Indicator form and click on [Save].
Fields description:
- Indicator Type: tick the box ‘Standard’.
- Sector/Cluster: you have the possibility to select the sector if it needs to be modified.
- Outcome Indicator *: select an Outcome Indicator from the drop-down list.Please note: the Standard Outcome Indicators proposed are linked to the sector previously selected.
- Target Value: enter the outcome indicator total target. When applicable, please add a breakdown by age and gender.
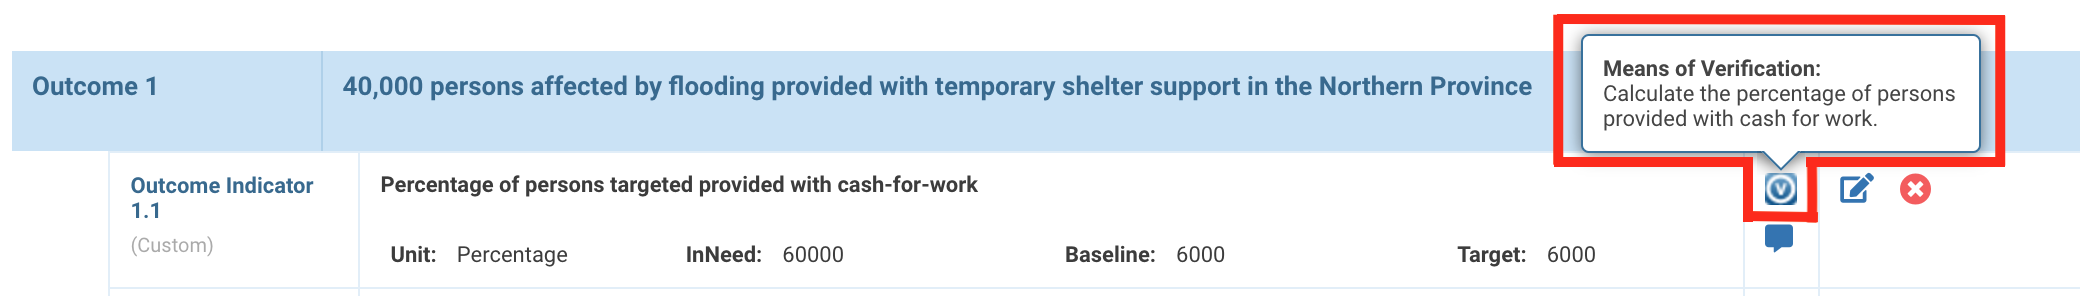
- Means of Verification: describe how you will verify if targets have been reached based on the selected indicator.
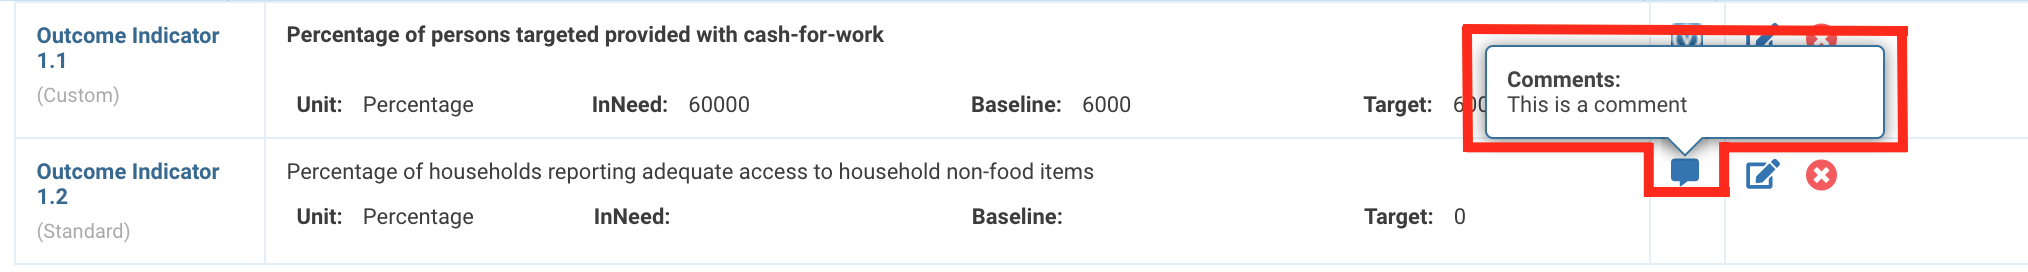
- Comments: you can leave a comment if necessary.
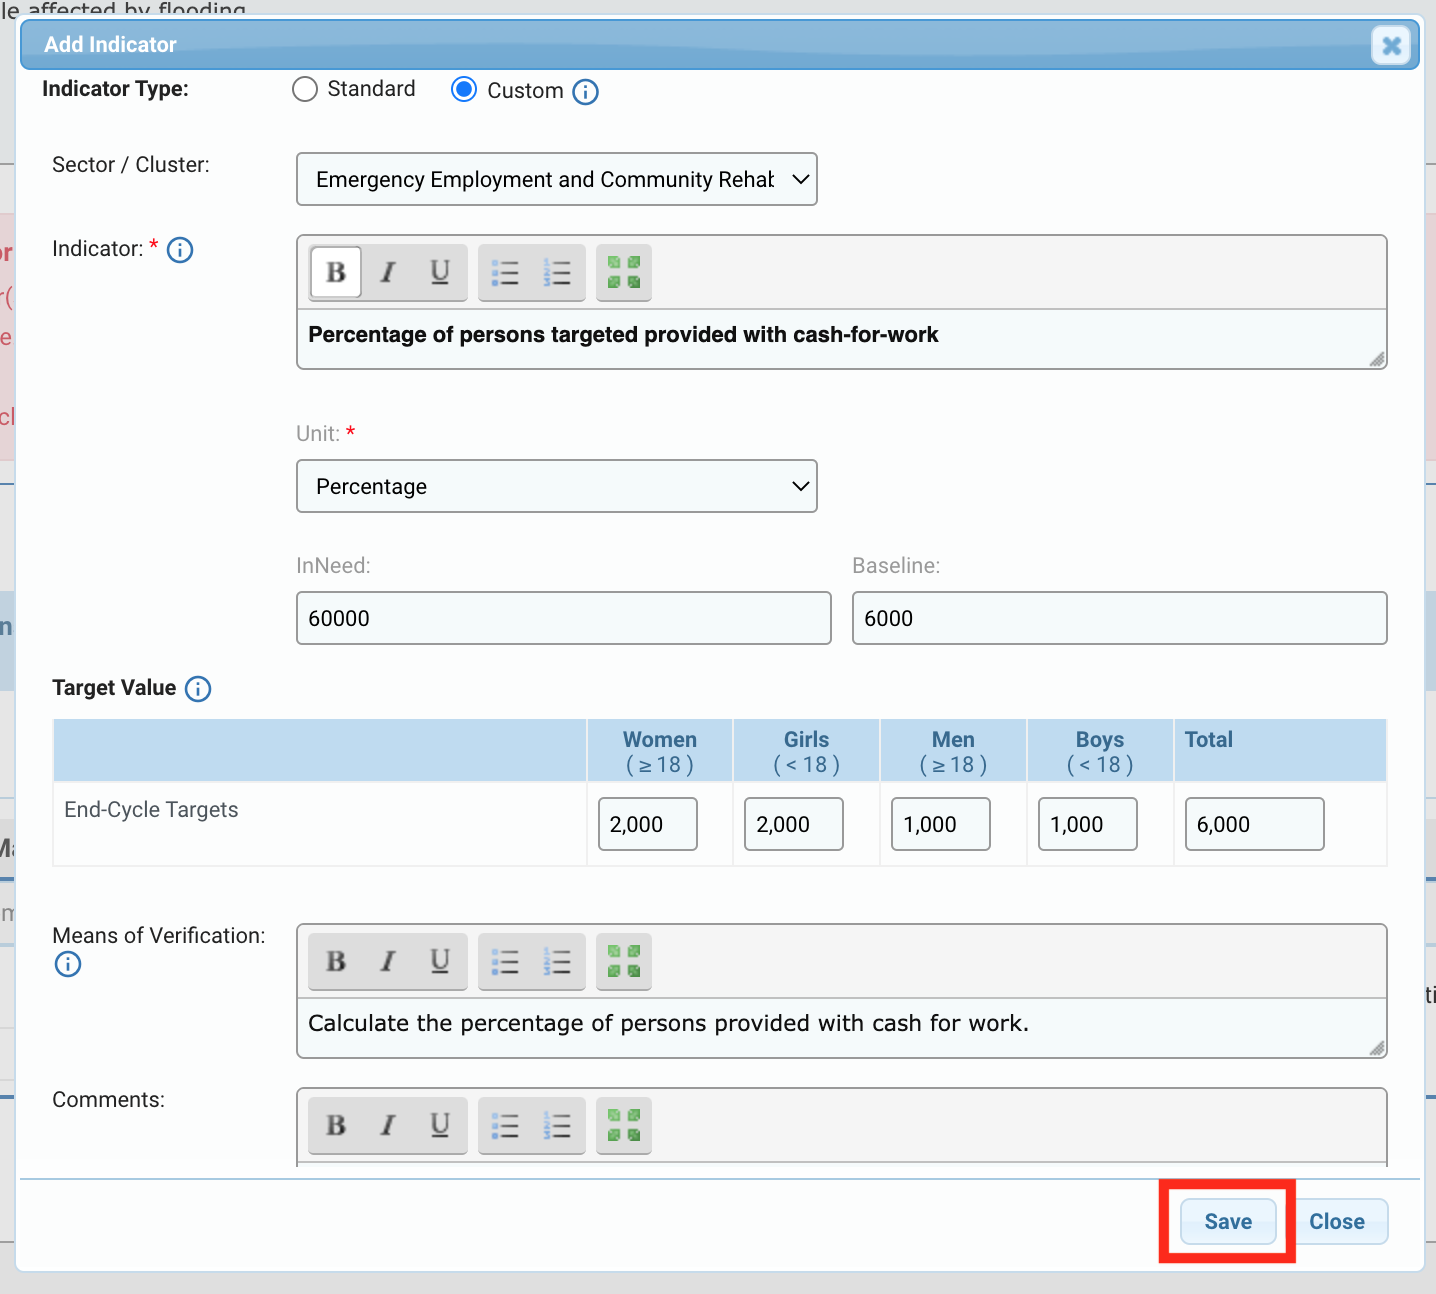
To add a Custom Outcome Indicator: once you have clicked on [Add Outcome Indicator], a pop-up window will appear.
Fields description:
- Indicator Type: tick the box ‘Custom’.
- Sector/Cluster: you have the possibility to select the sector if it needs to be modified.
- Indicator *: describe the custom indicator.
- Unit *: select from the drop-down list the unit of the custom indicator.
- In Need: you can indicate the overall need for that indicator.
- Baseline: you can indicate the target of this allocation.
- Target Value: enter the custom indicator total target. When applicable, please add a breakdown by age and gender.
- Means of Verification: describe how you will verify if targets have been reached based on the selected indicator.
- Comments: you can leave a comment if necessary.
To save the data, click on [Save].
Once saved, the indicators will be displayed on the table. For Standard Indicators, the fields ‘In Need’ (i.e., the overall need for that indicator) and ‘Baseline’ (i.e., target of this allocation) are automatically added by the HFU according to the HRP’s data. If these fields are empty, it means that the HRP does not provide this information for the selected Standard Indicator.
You can click on this icon ![]() to edit the Outcome Indicator or on
to edit the Outcome Indicator or on![]() to delete it.
to delete it.

This icon ![]() indicates that a comment was left against the indicator. You can hover over it to display the comment.
indicates that a comment was left against the indicator. You can hover over it to display the comment.
This icon![]() indicates that a mean of verification was added to the indicator. You can hover over it to see the mean of verification.
indicates that a mean of verification was added to the indicator. You can hover over it to see the mean of verification.
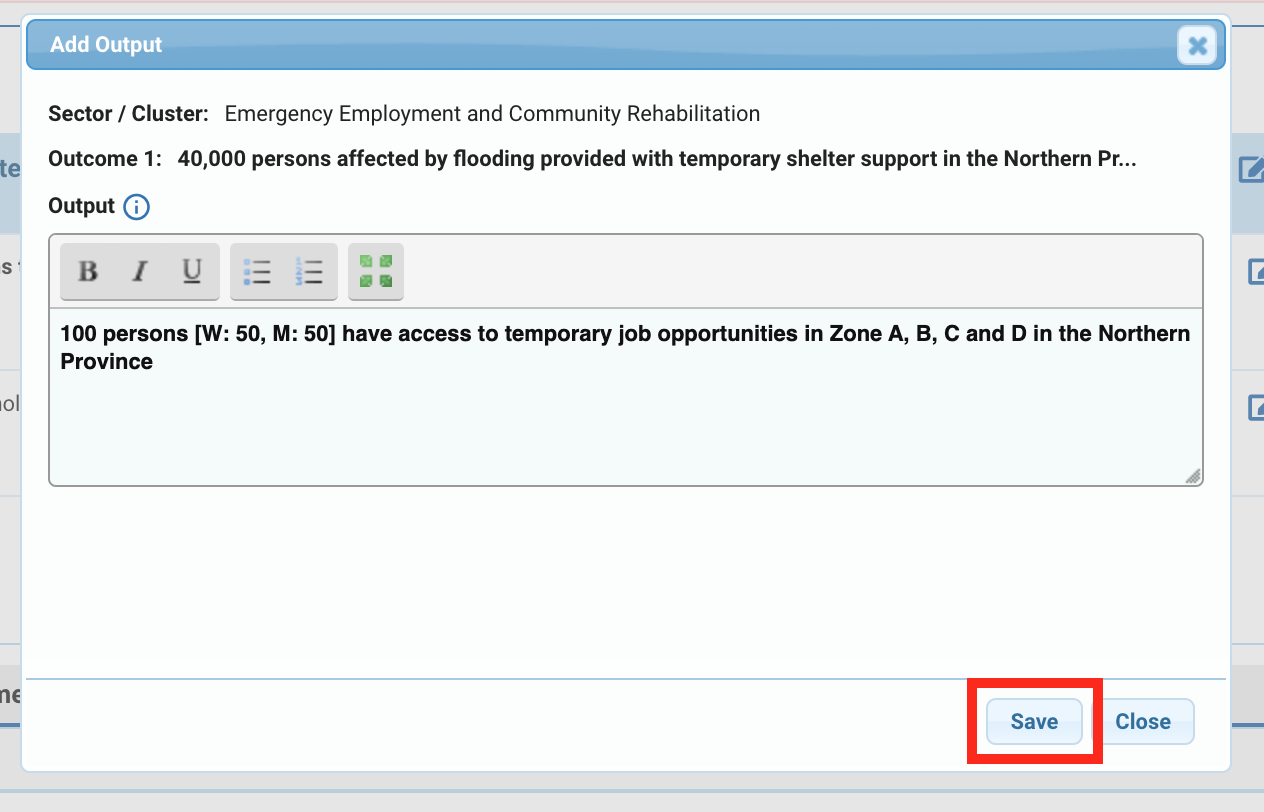
d. Add an Output to each Outcome. Click on [Add Output].
Please note: the output measures the number of people receiving a service/type of assistance and the amount of service/type of assistance delivered (e.g., the number of people receiving food assistance, or the tonnage of food distributed).
Fill out the narrative box in the pop-up window and click on [Save] to add the output.
Once added, a new row will be created. You can click on this icon ![]() to edit the output or on
to edit the output or on ![]() to delete it.
to delete it.
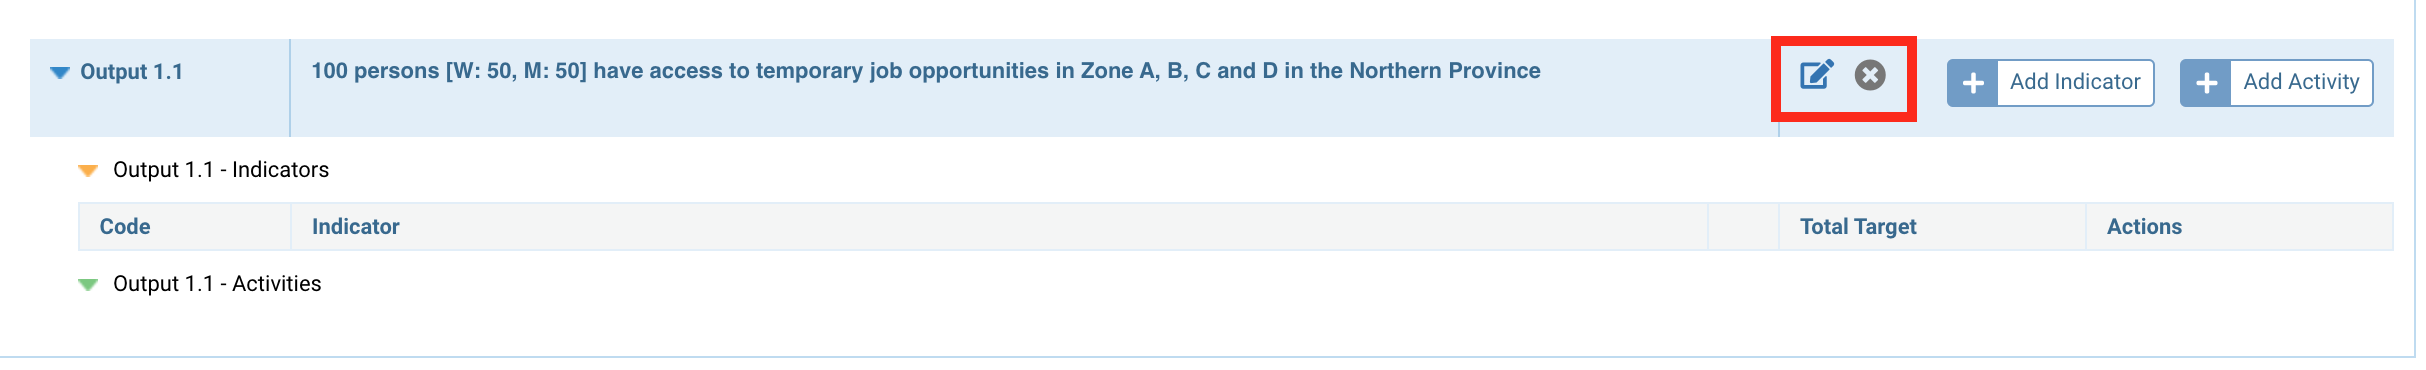
e. Add at least one Standard Indicator per Output and add Custom Indicators if necessary. Click on [Add Indicator].

To add a Standard Output Indicator: once you have clicked on [Add Indicator], a pop-up window will appear.
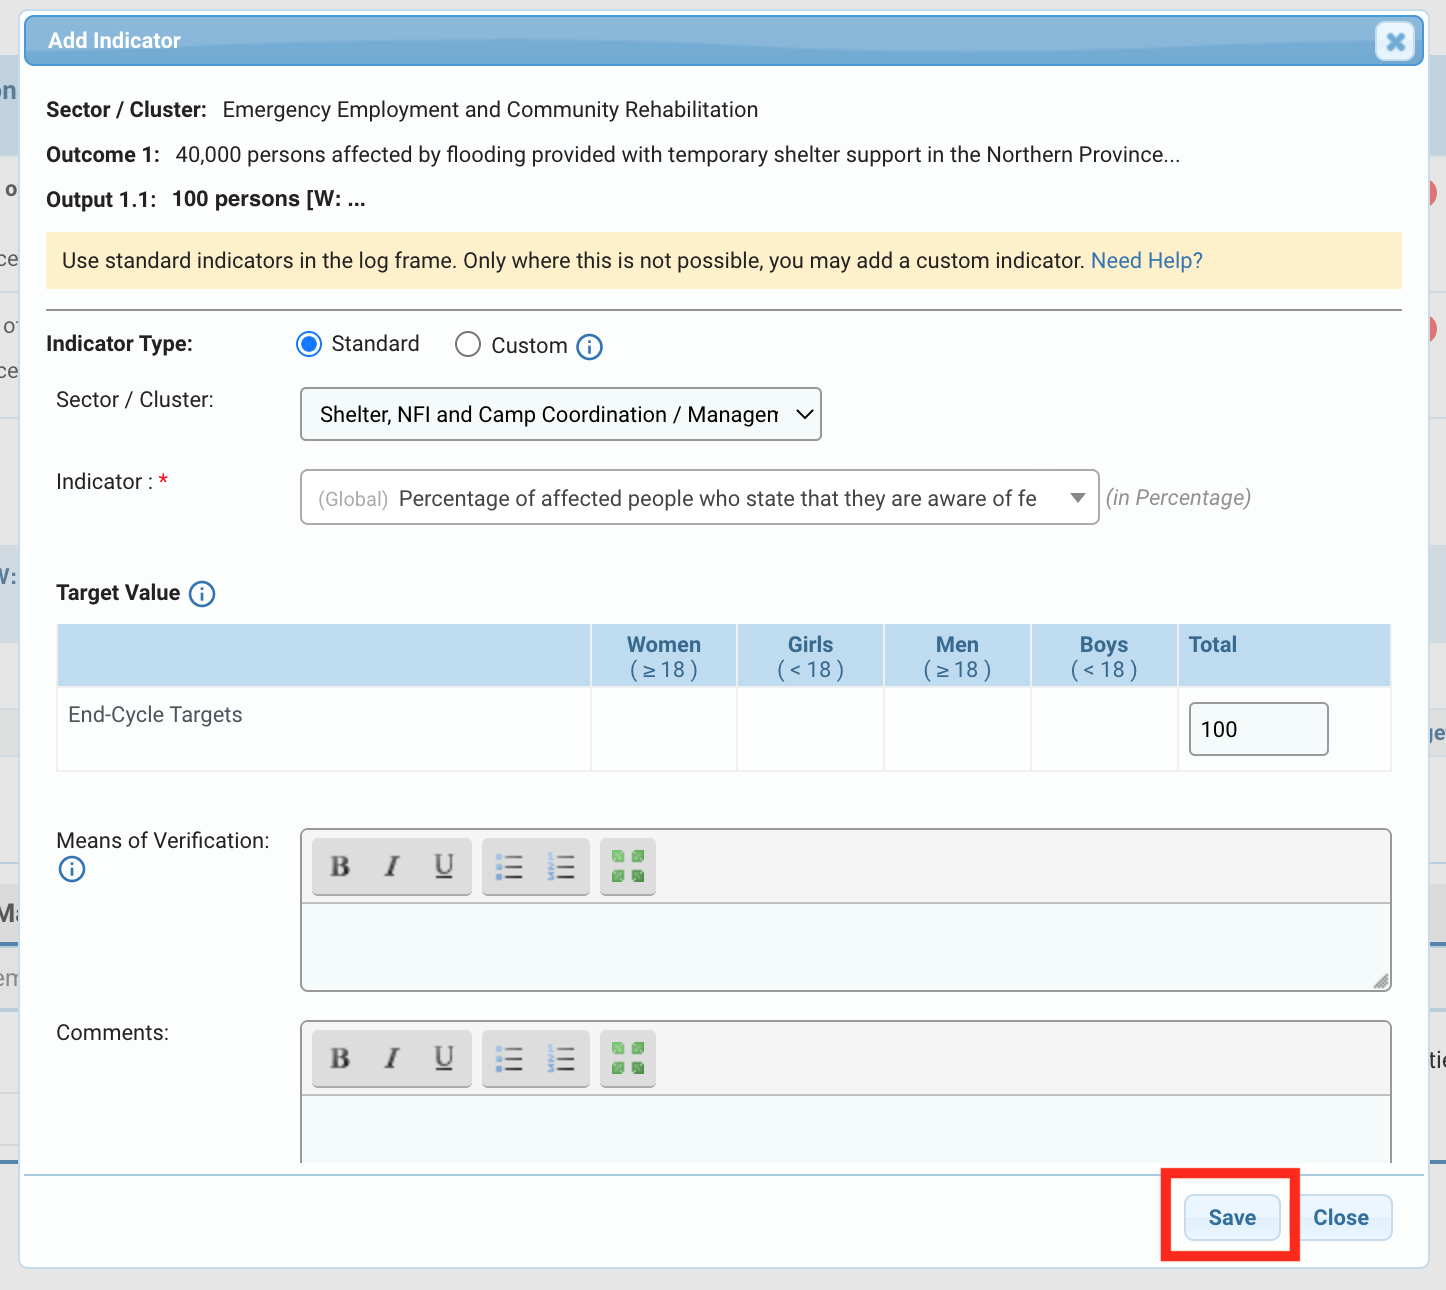
Fields description:
- Indicator Type: tick the box ‘Standard’.
- Sector/Cluster: you have the possibility to select the sector if it needs to be modified.
- Output Indicator *: select an Output Indicator from the drop-down list.
- Target Value: enter the output indicator total target. When applicable, please add a breakdown by age and gender.
- Means of Verification: describe how you will verify if targets have been reached based on the selected indicator.
- Comments: you can leave a comment if necessary.
To save the data, click on [Save].
To add a Custom Output Indicator: once you have clicked on [Add Indicator], a pop-up window will appear.
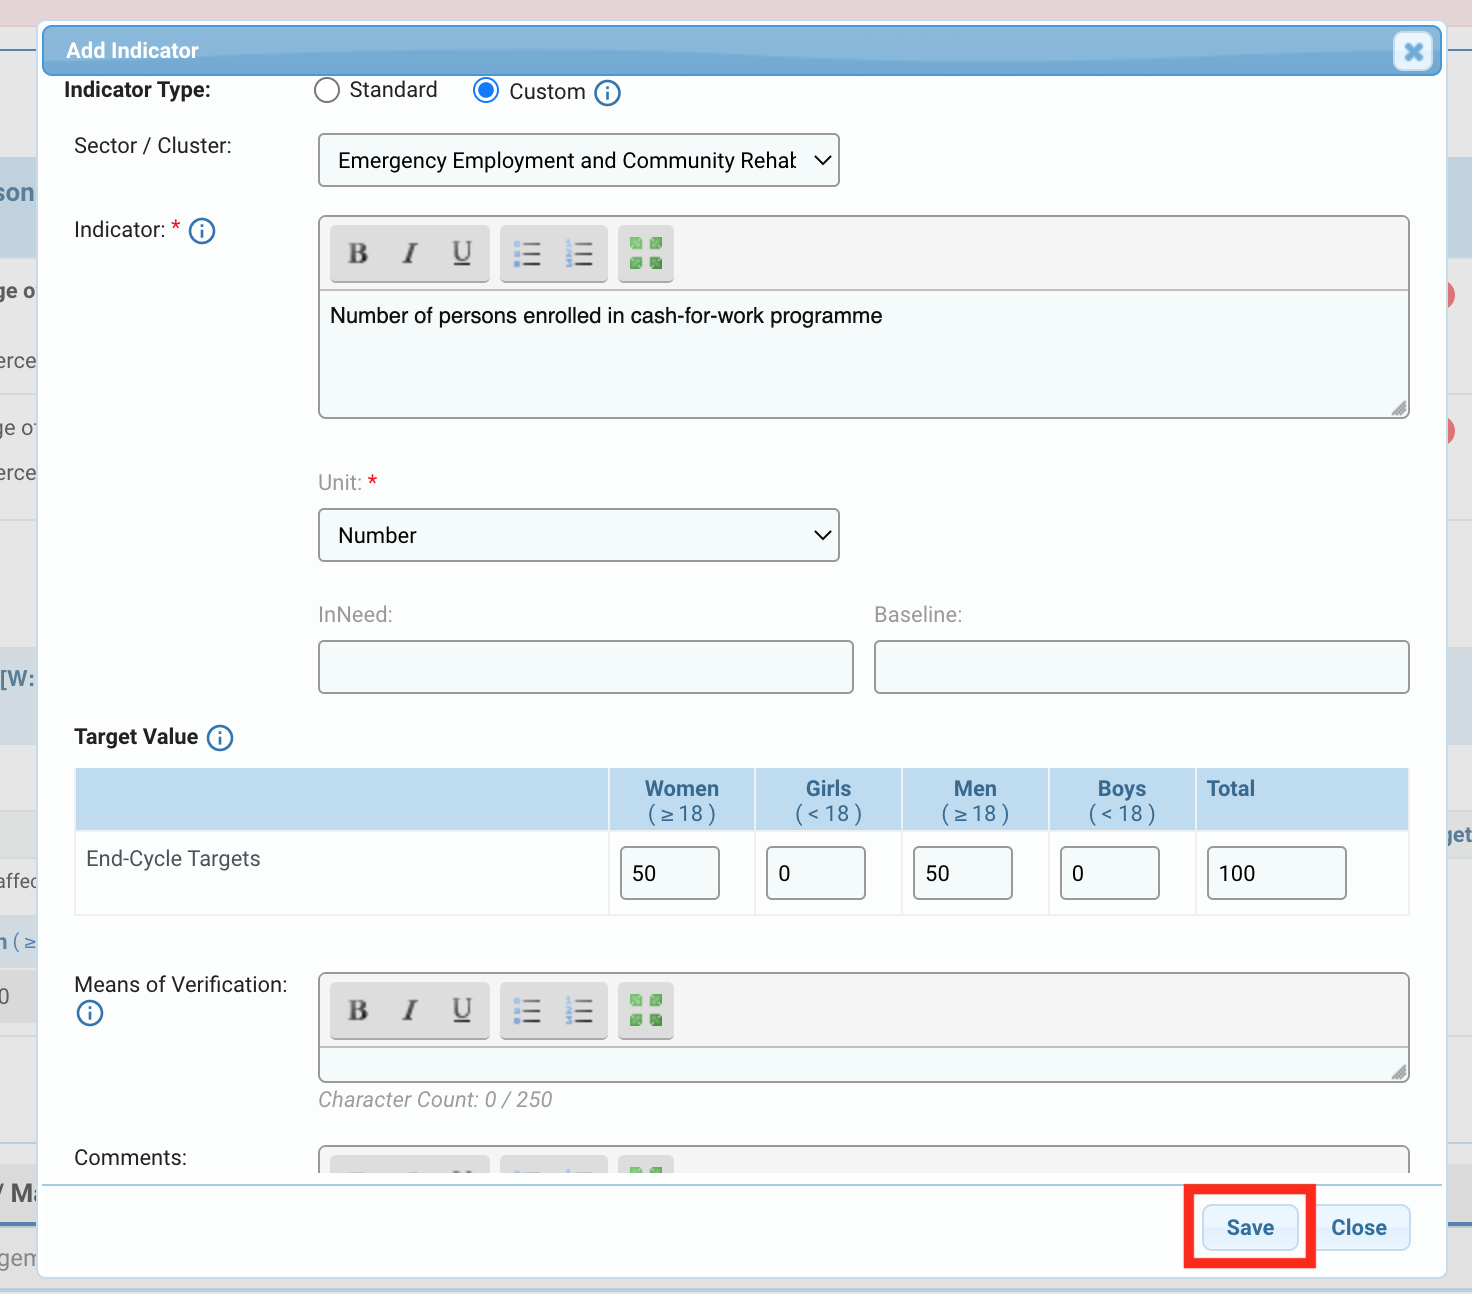
Fields description:
- Indicator Type: tick the box ‘Custom’.
- Sector/Cluster: you have the possibility to select the sector if it needs to be modified.
- Indicator *: describe the custom output indicator.
- Unit *: select from the drop-down list the unit of the custom output indicator.
- In Need: you can indicate the overall need for that indicator.
- Baseline: you can indicate the target of this allocation.
- Target Value: enter the custom indicator total target. When applicable, please add a breakdown by age and gender.
- Means of Verification: describe how you will verify if targets have been reached based on the selected indicator.
- Comments: you can leave a comment if necessary.
To save the data, click on [Save].
Once saved, the output indicators will be displayed in the table. You can click on this icon![]() to edit the output indicator or on
to edit the output indicator or on![]() to delete it.
to delete it.
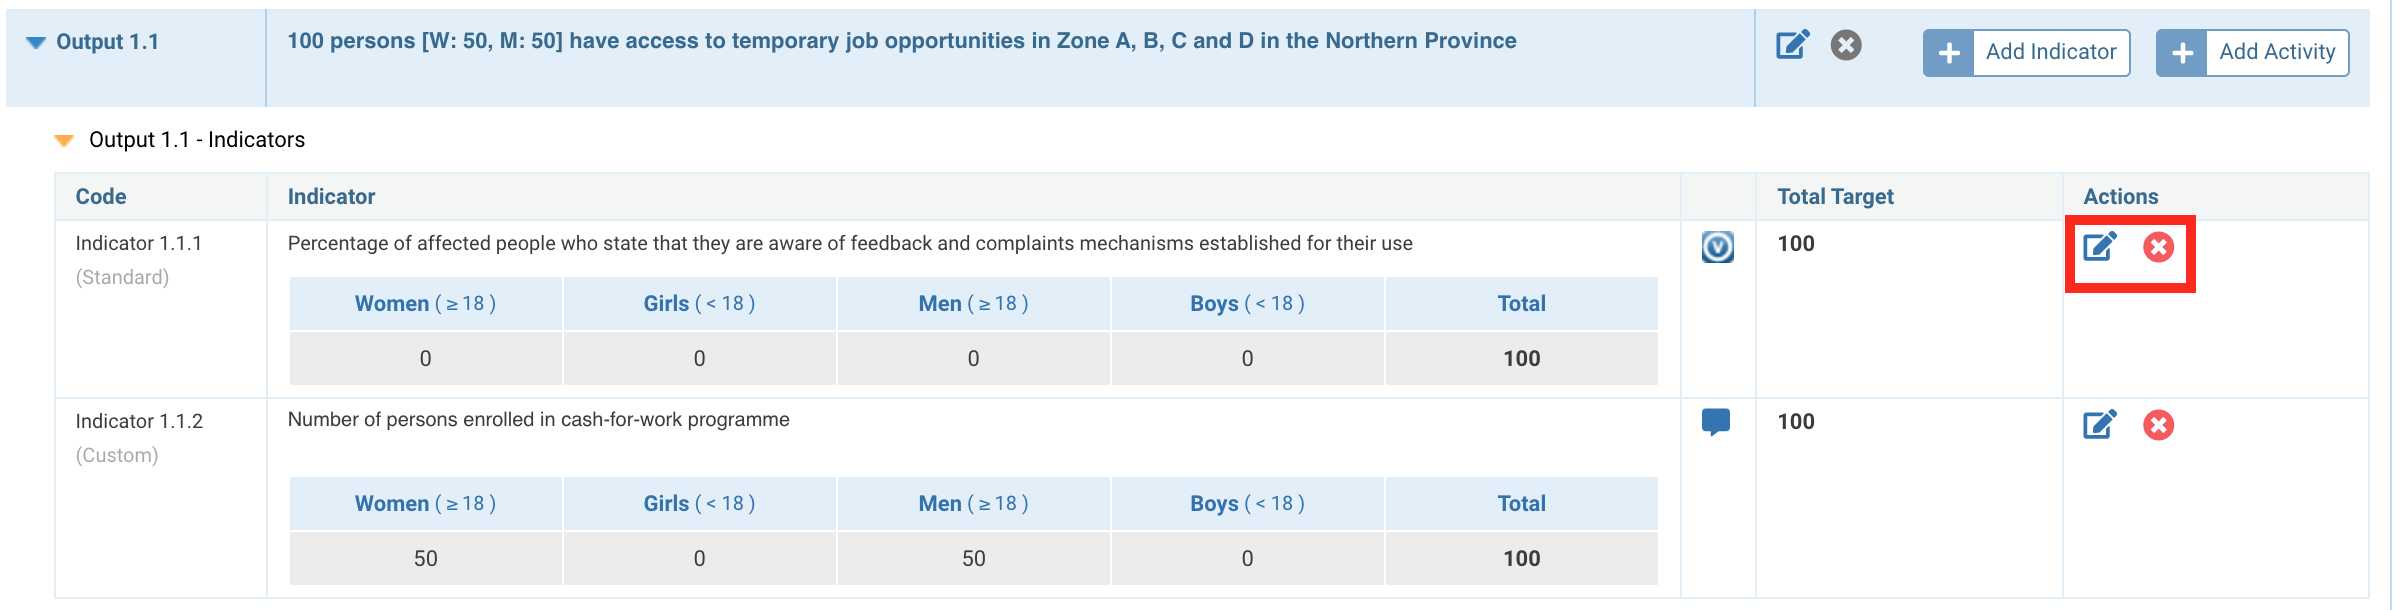
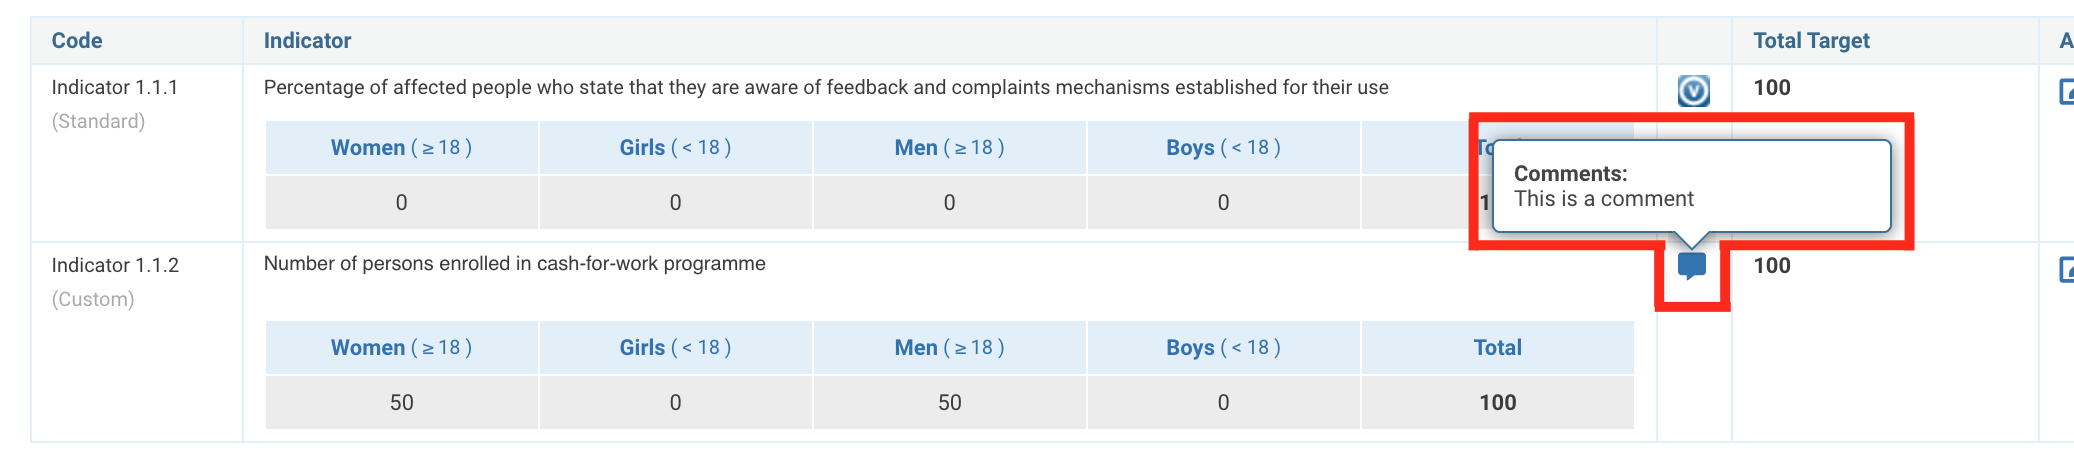
This icon ![]() indicates that a comment was left against the indicator. You can hover over it to display the comment.
indicates that a comment was left against the indicator. You can hover over it to display the comment.
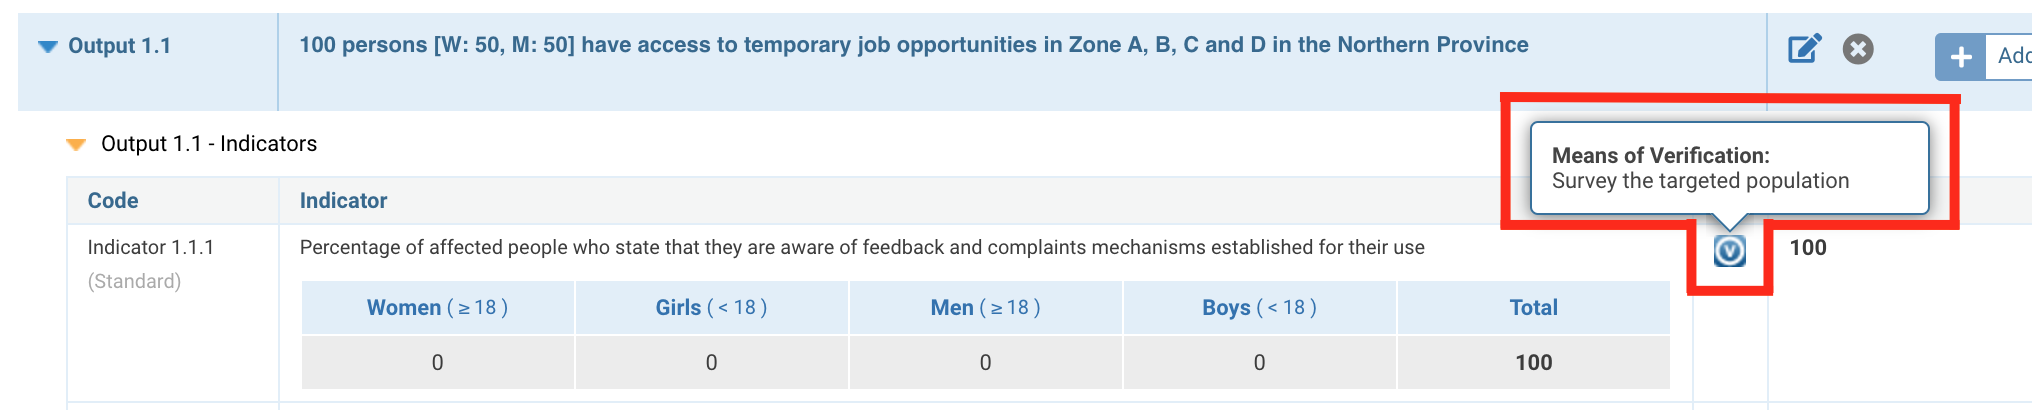
This icon![]() indicates that a mean of verification was added to the indicator. You can hover over it to see the mean of verification.
indicates that a mean of verification was added to the indicator. You can hover over it to see the mean of verification.
f. Add at least one activity per Output. Click on [Add Activity].
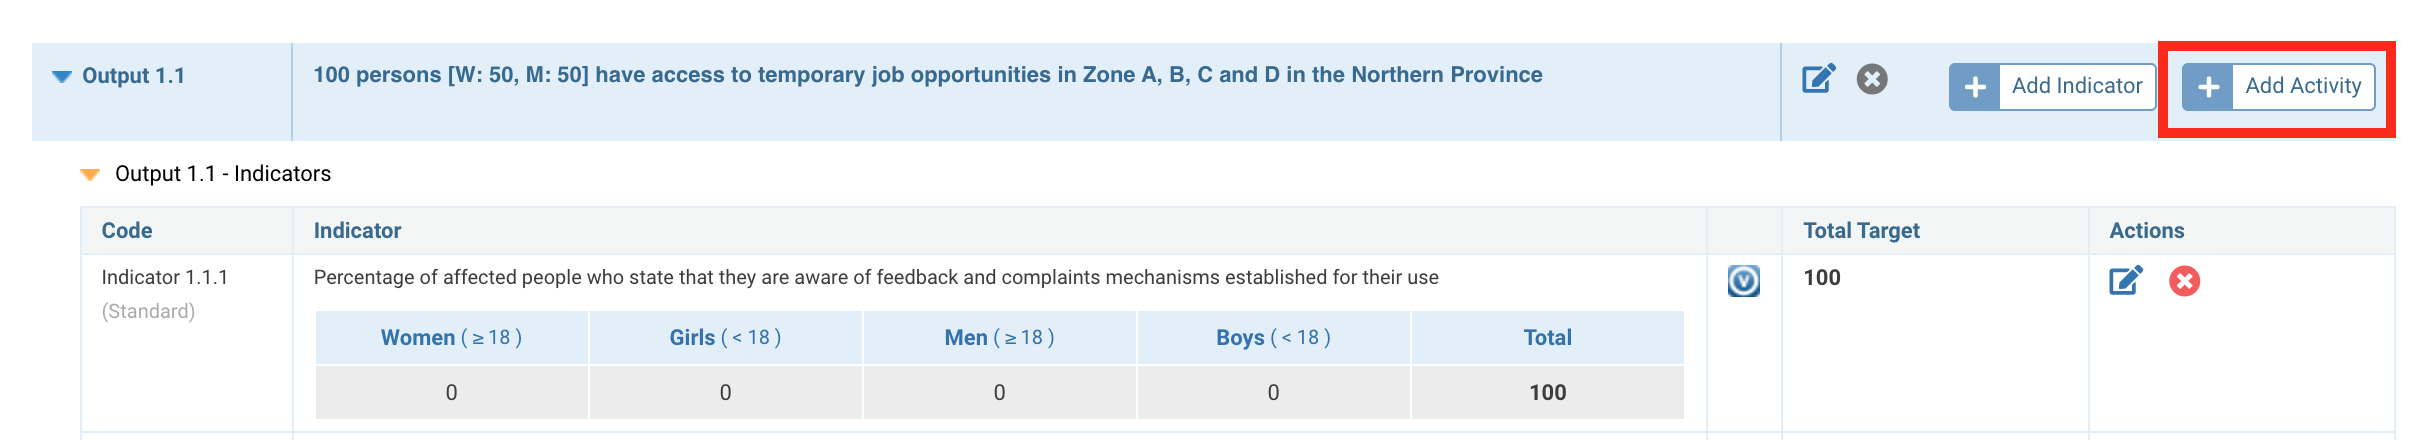
On the pop-up window, select a Standard Activity from the drop-down list. If no activities are available in the drop-down list, you can describe the planned activity in the narrative box. Then click on [Save] to add the activity.
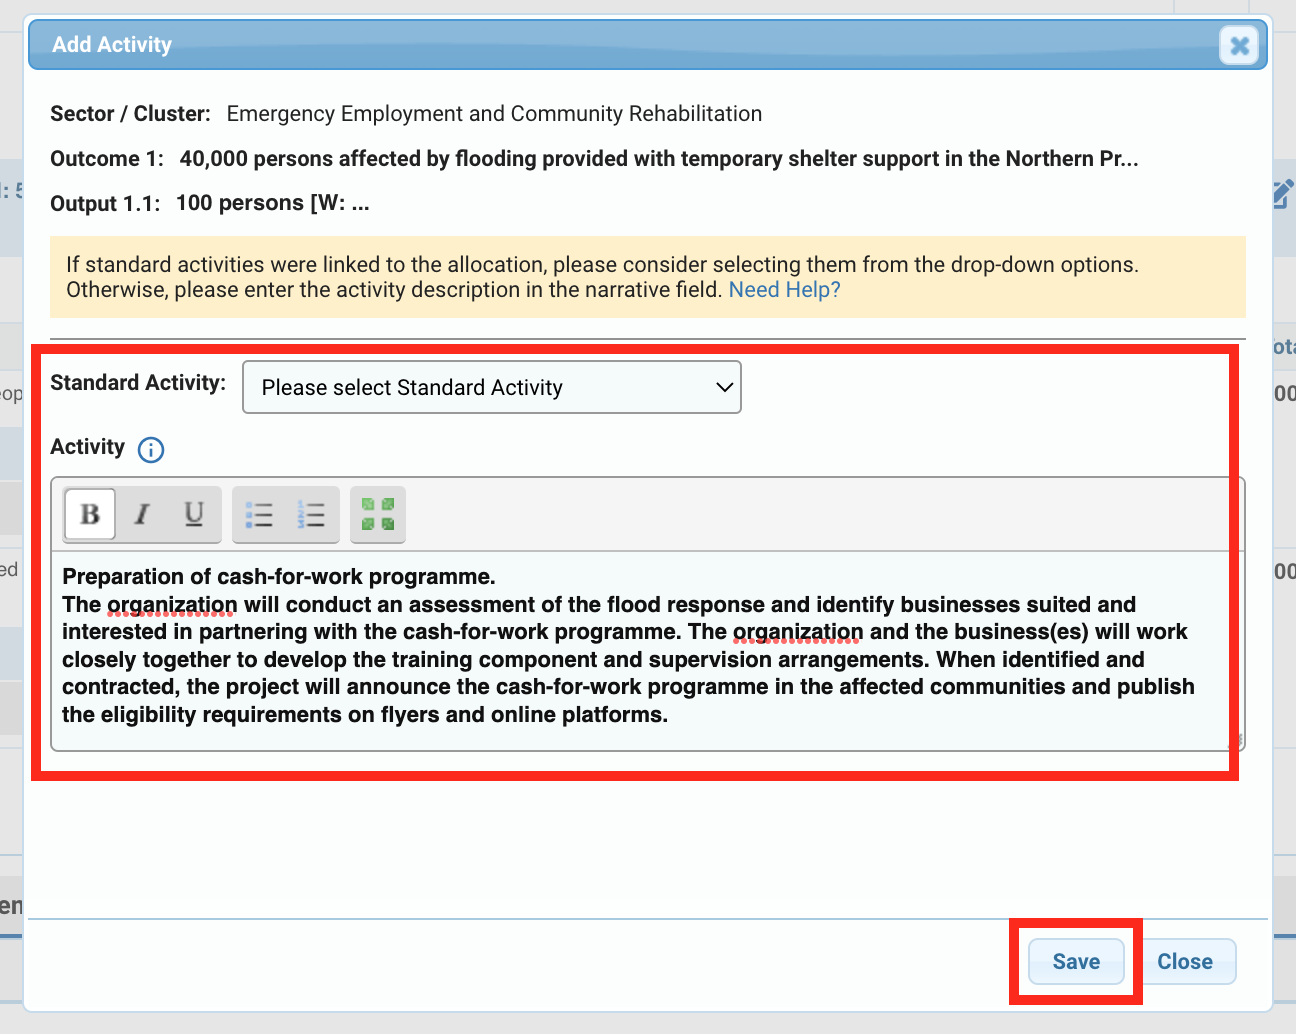
Please note: the activities selected will be added automatically to the ‘Work Plan’, and ‘Locations’ tabs.
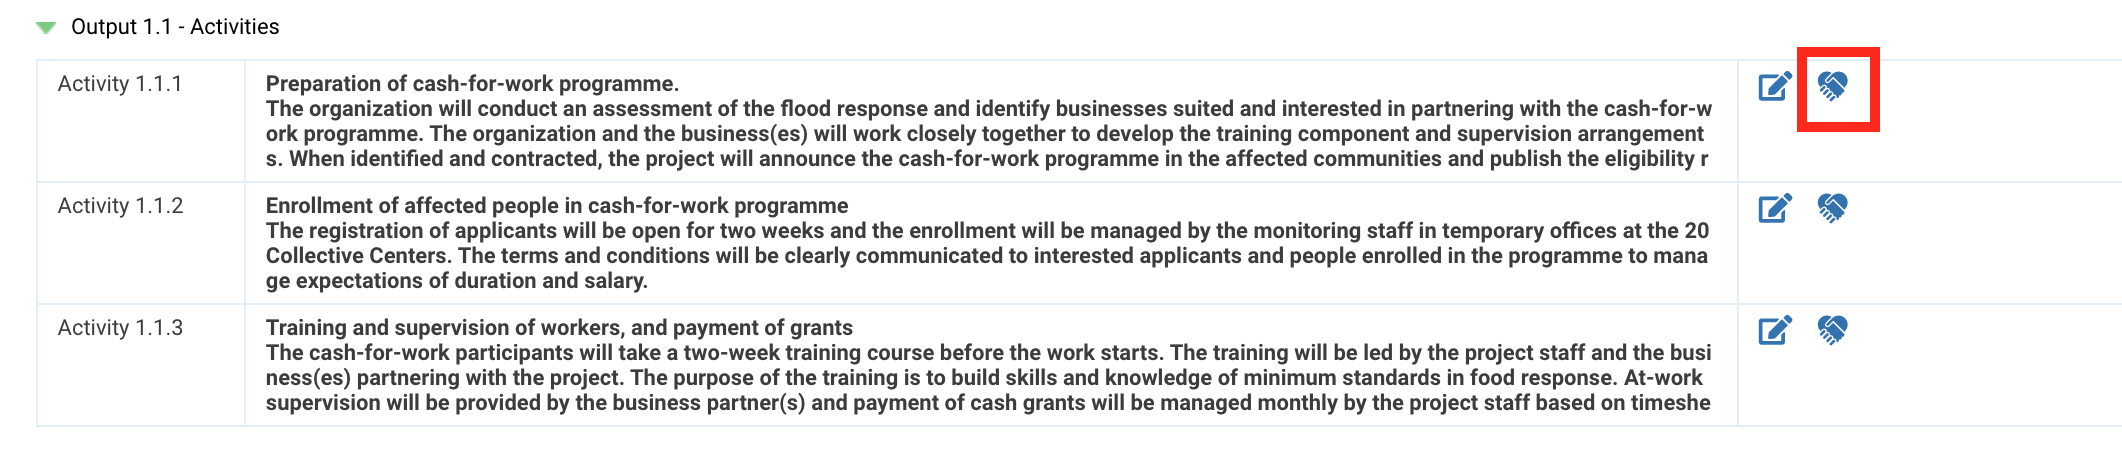
Activities are added below the Output Indicators. You can edit an activity by clicking on this icon![]() or delete it by clicking on
or delete it by clicking on![]() .
.
After the completion of the ‘Subgrants’ tab, and if a sub-implementing partner is linked to an activity, this icon ![]() will appear on the activity line. You can hover over it to display the name of the sub-implementing partner.
will appear on the activity line. You can hover over it to display the name of the sub-implementing partner.
Please note: once you have completed this tab, do not forget to save your progress, as the system will not automatically save it.
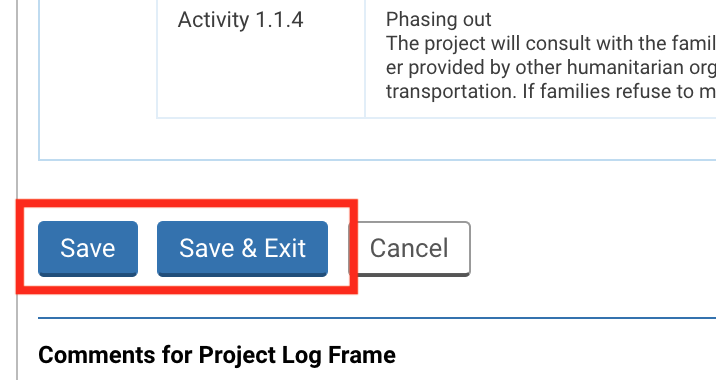
You can find the save buttons at the top of the page,
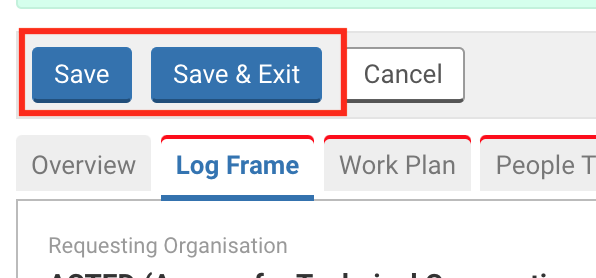
or the bottom of it.