I) What are the different components of the infographic?
II) How to access the data?
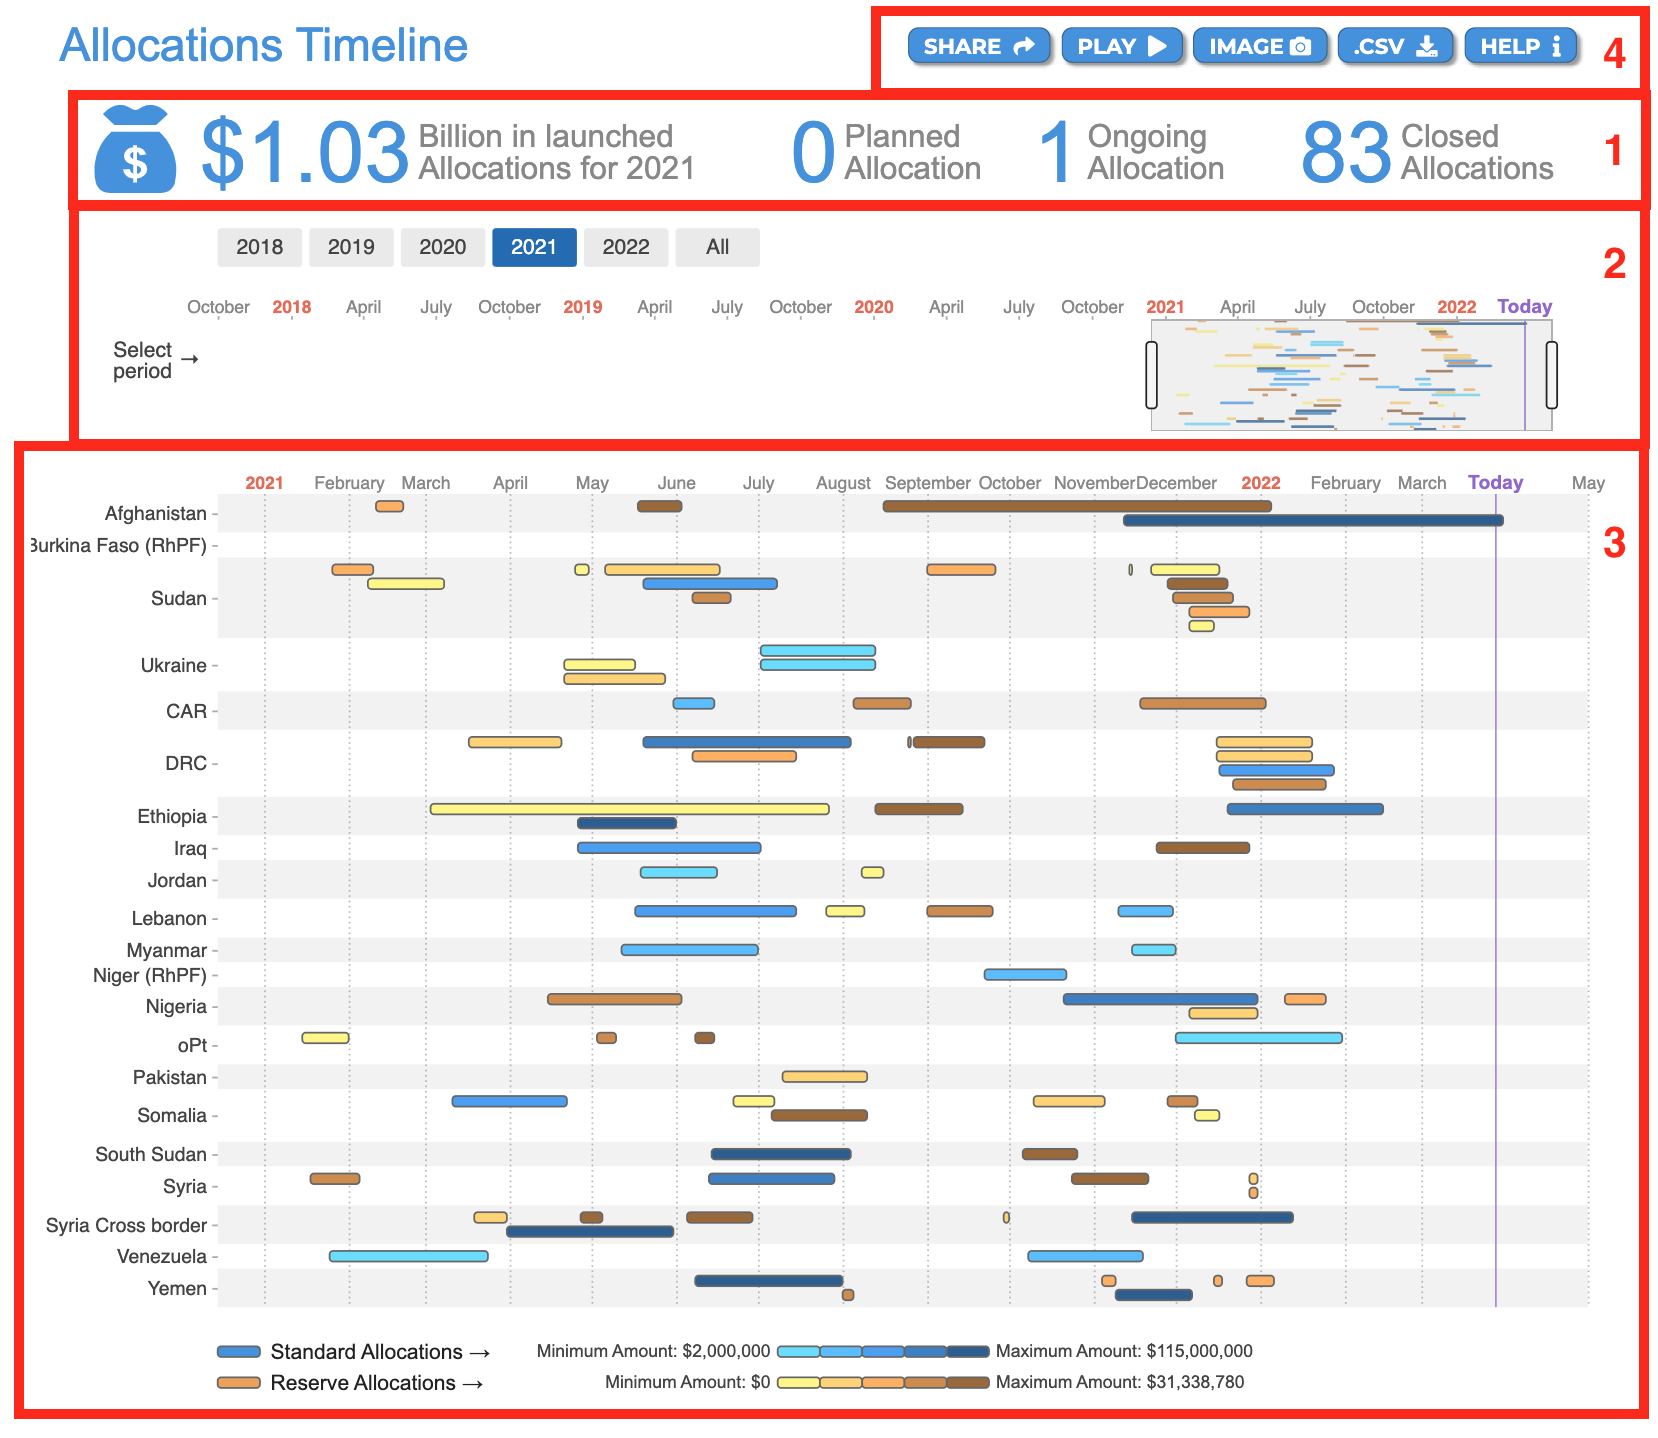
This visual shows the timeline of allocations per CBPF since 2018. It indicates the start and end dates of the allocation, the overall allocation amount, the allocation summary and the Humanitarian Response Plan’s (HRP) targets at the core of the allocation.

I) What are the different components of the infographic?
Please see below the description of fields 1-4 as annotated in red in the screenshot above.
-
The Allocations’ key figures: they reflect the filters applied, and give the following information:
a. The amount, in USD, of the launched allocations.
b. The number of planned allocations.
c. The number of ongoing allocations.
d. The number of closed allocations. -
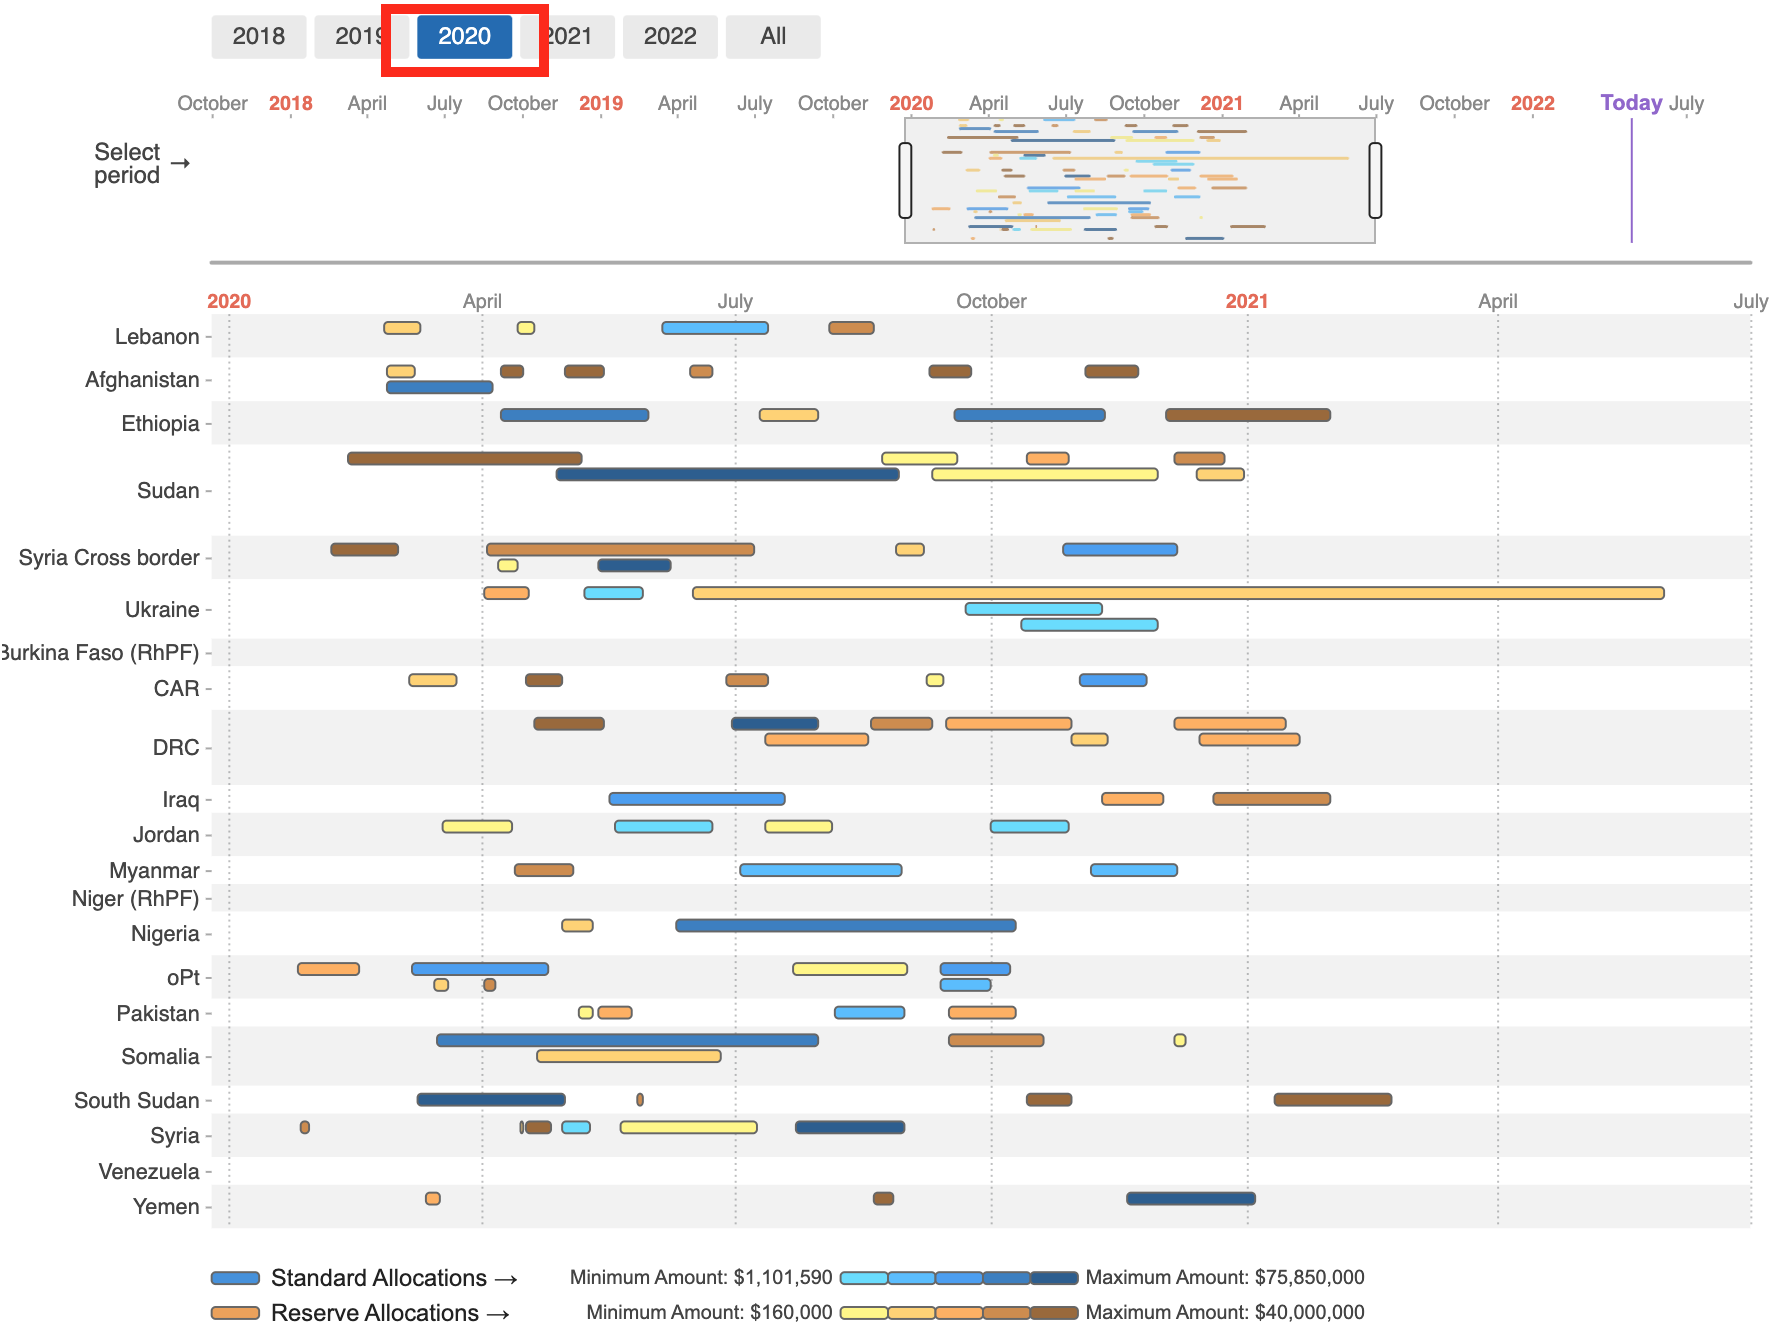
The filter options: users can select one allocation year by clicking on it, multiple allocation years by double clicking on them, or all allocation years since 2018 by clicking on [All]. The selected year(s) is/are reflected below. For more information on the year/period filter, go to the GMS Focus below.
-
The Gaant chart: displays the timeline of allocations per CBPF since 2018. Standard Allocations are shown in a blue gradient corresponding to the amount allocated, while Reserve Allocations are shown in a brown gradient.
-
The usual CBPF Data Hub tooltips: Share, Play, Image, .CVS and Help. To know more about these tooltips, please click here.
|
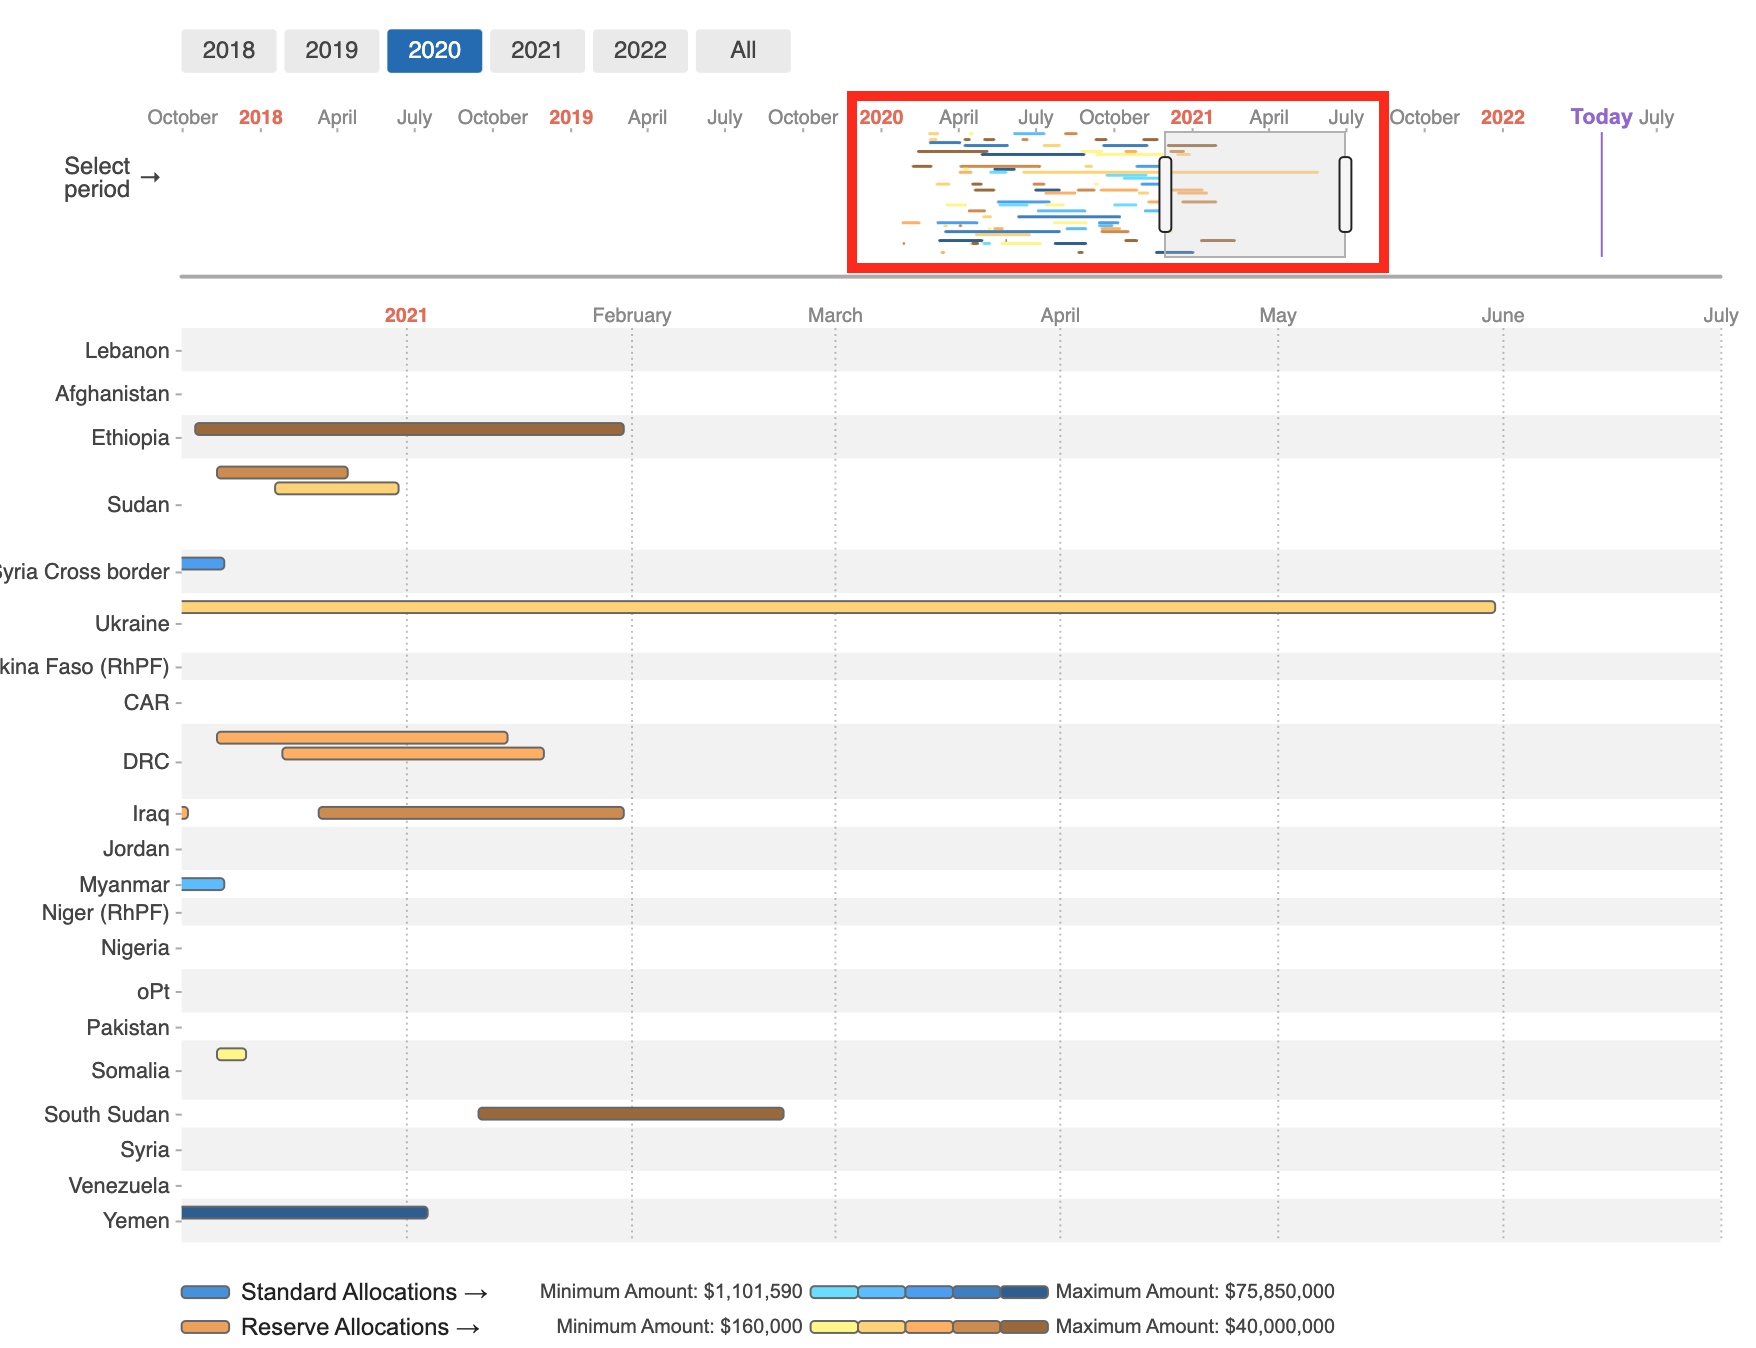
GMS Focus: The year vs. period filter option The year filter allows the user to display all the allocations launched during the selected year(s). In other terms, the ‘year’ here actually corresponds to the ‘allocation year’.
The scaled-down version of the Gantt chart (i.e., the period filter) displayed below the years shows the implementation period of the allocations. It allows the user to zoom in the allocations and see their implementation period, even if it was after the selected year(s). You can move the slider to have a more precise view.
|
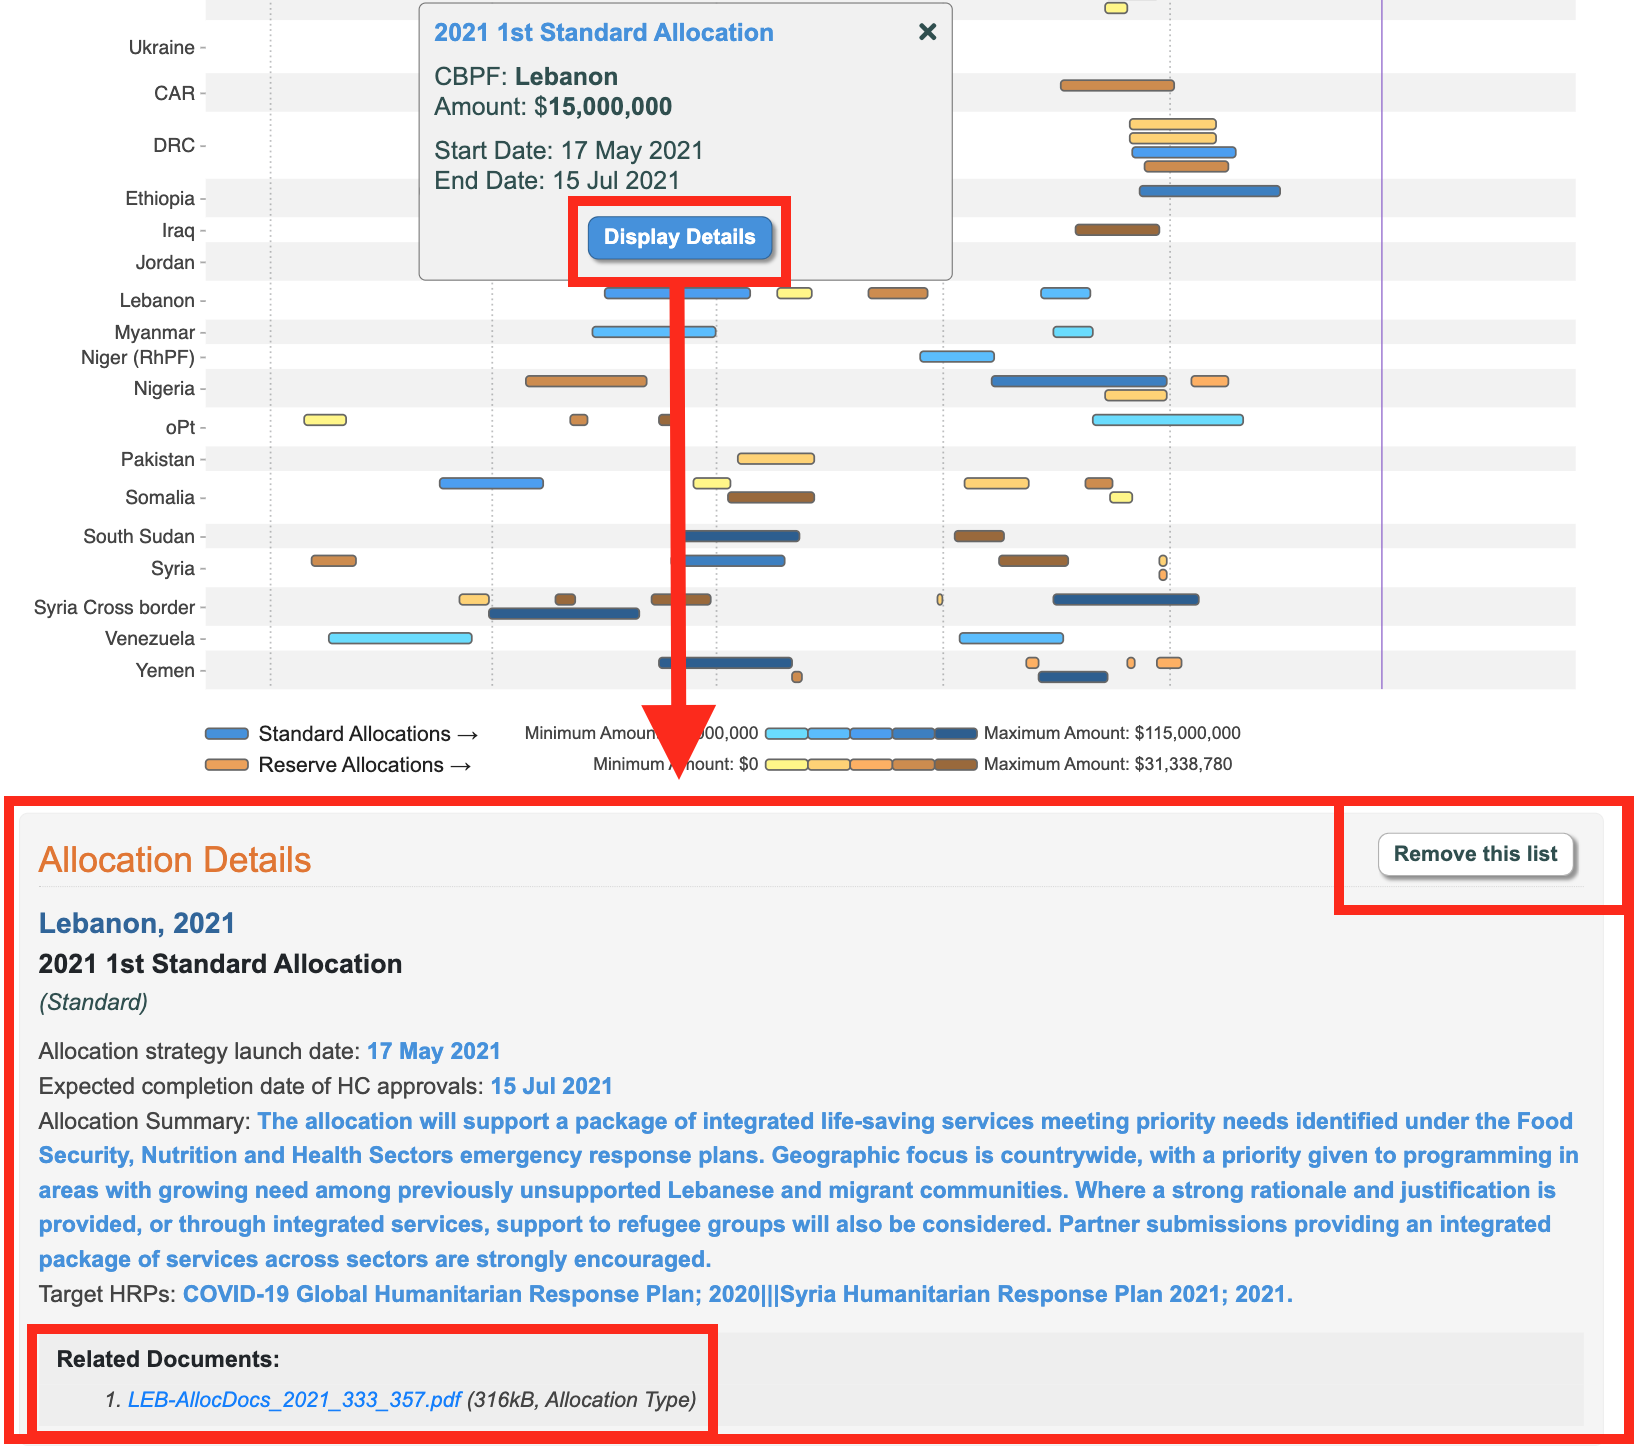
Once you have selected the year(s), you can hover over an allocation line in the graph to see a pop-up window with the allocation’s main points:
- CBPF: the fund’s name.
- Amount: the amount in USD allocated by the allocation.
- Start Date: the allocation’s start date.
- End Date: the allocation’s end date.
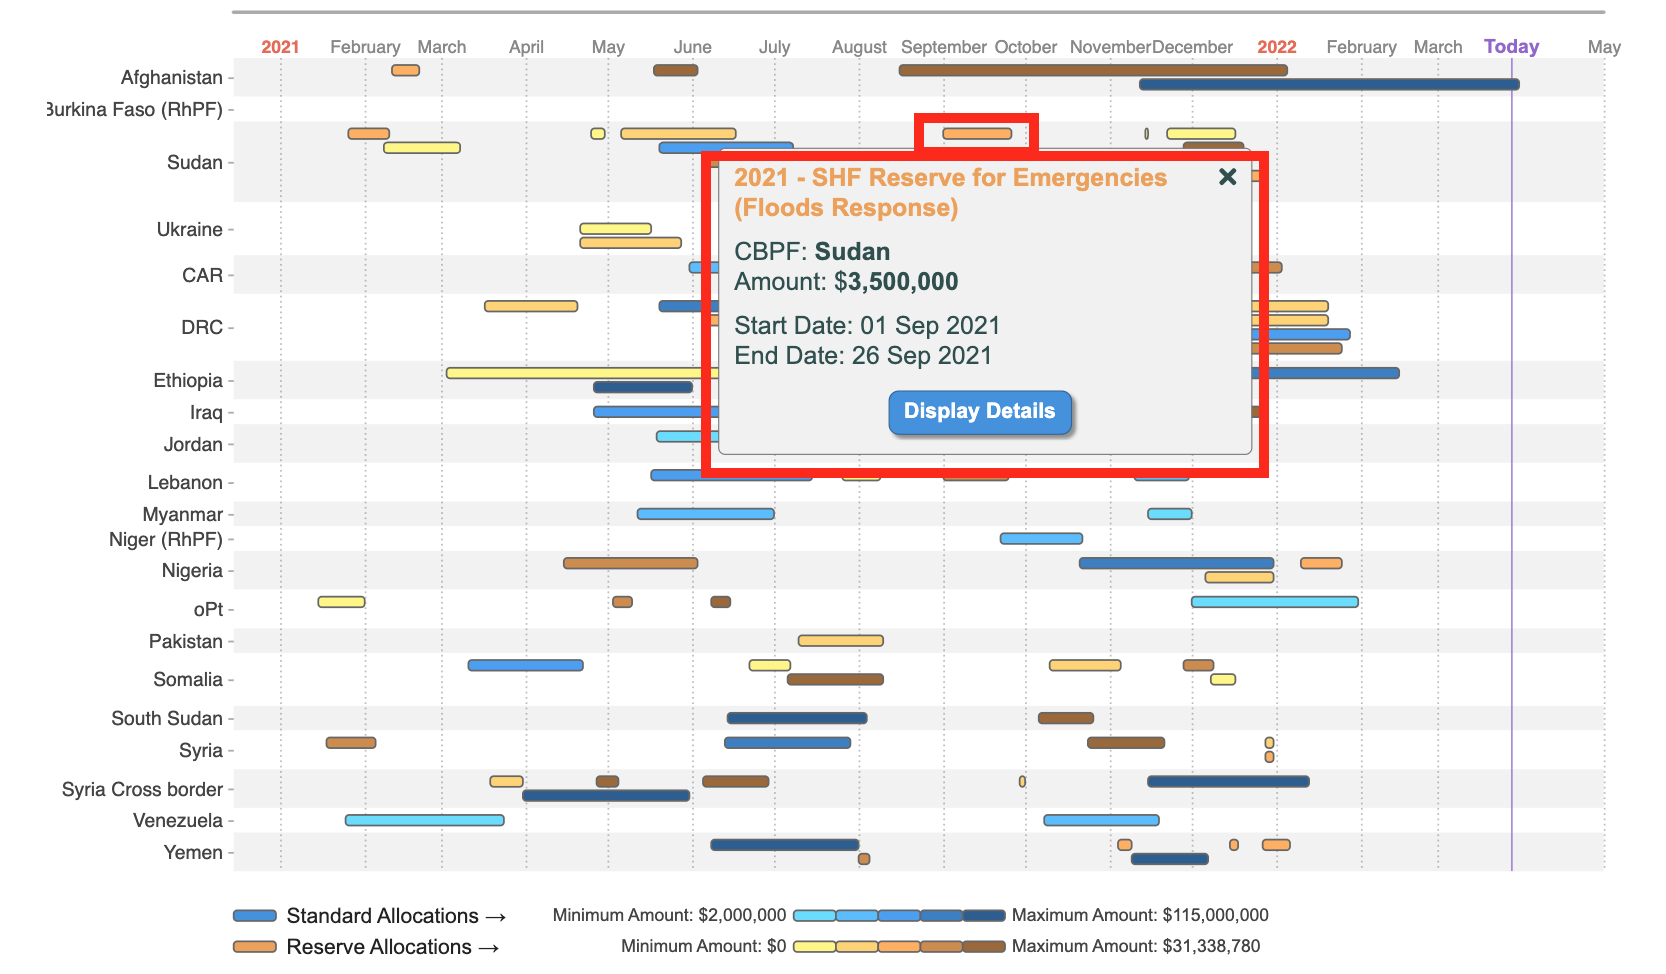
Click on [Display Details] to access the Allocation Details, a section with more data on the allocation. You can download the allocation strategy paper by clicking on the document’s link at the bottom of this new section. To close this section, click on [Remove this list].