I) What are the different components of the infographic?
II) How to access the data?
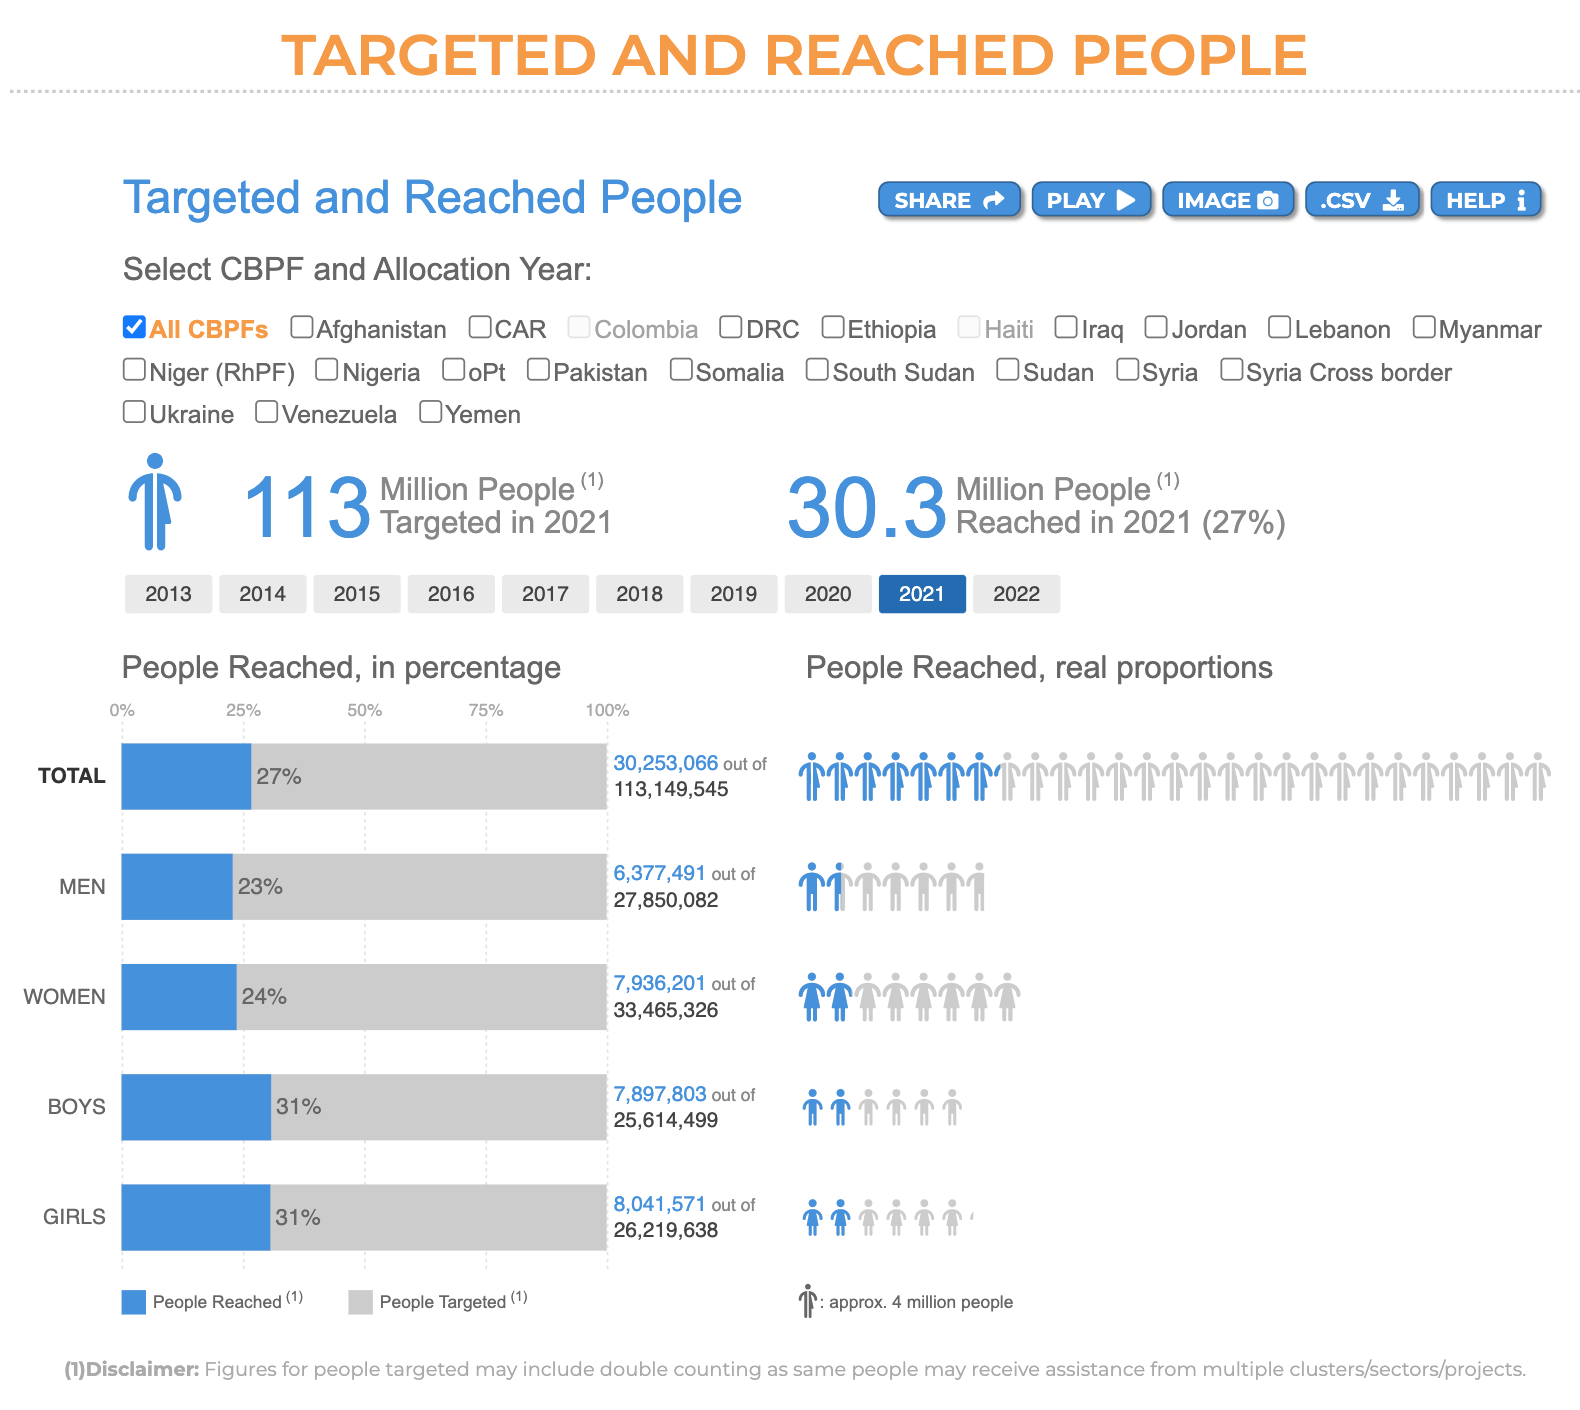
The Targeted and Reached People visualisation focuses on the persons affected by the crisis that prompted the establishment of the CBPF. The visual shows both the number of persons that will targeted through the CBPF-funded humanitarian projects, and the actual number of affected persons reached.
I) What are the different components of the infographic?
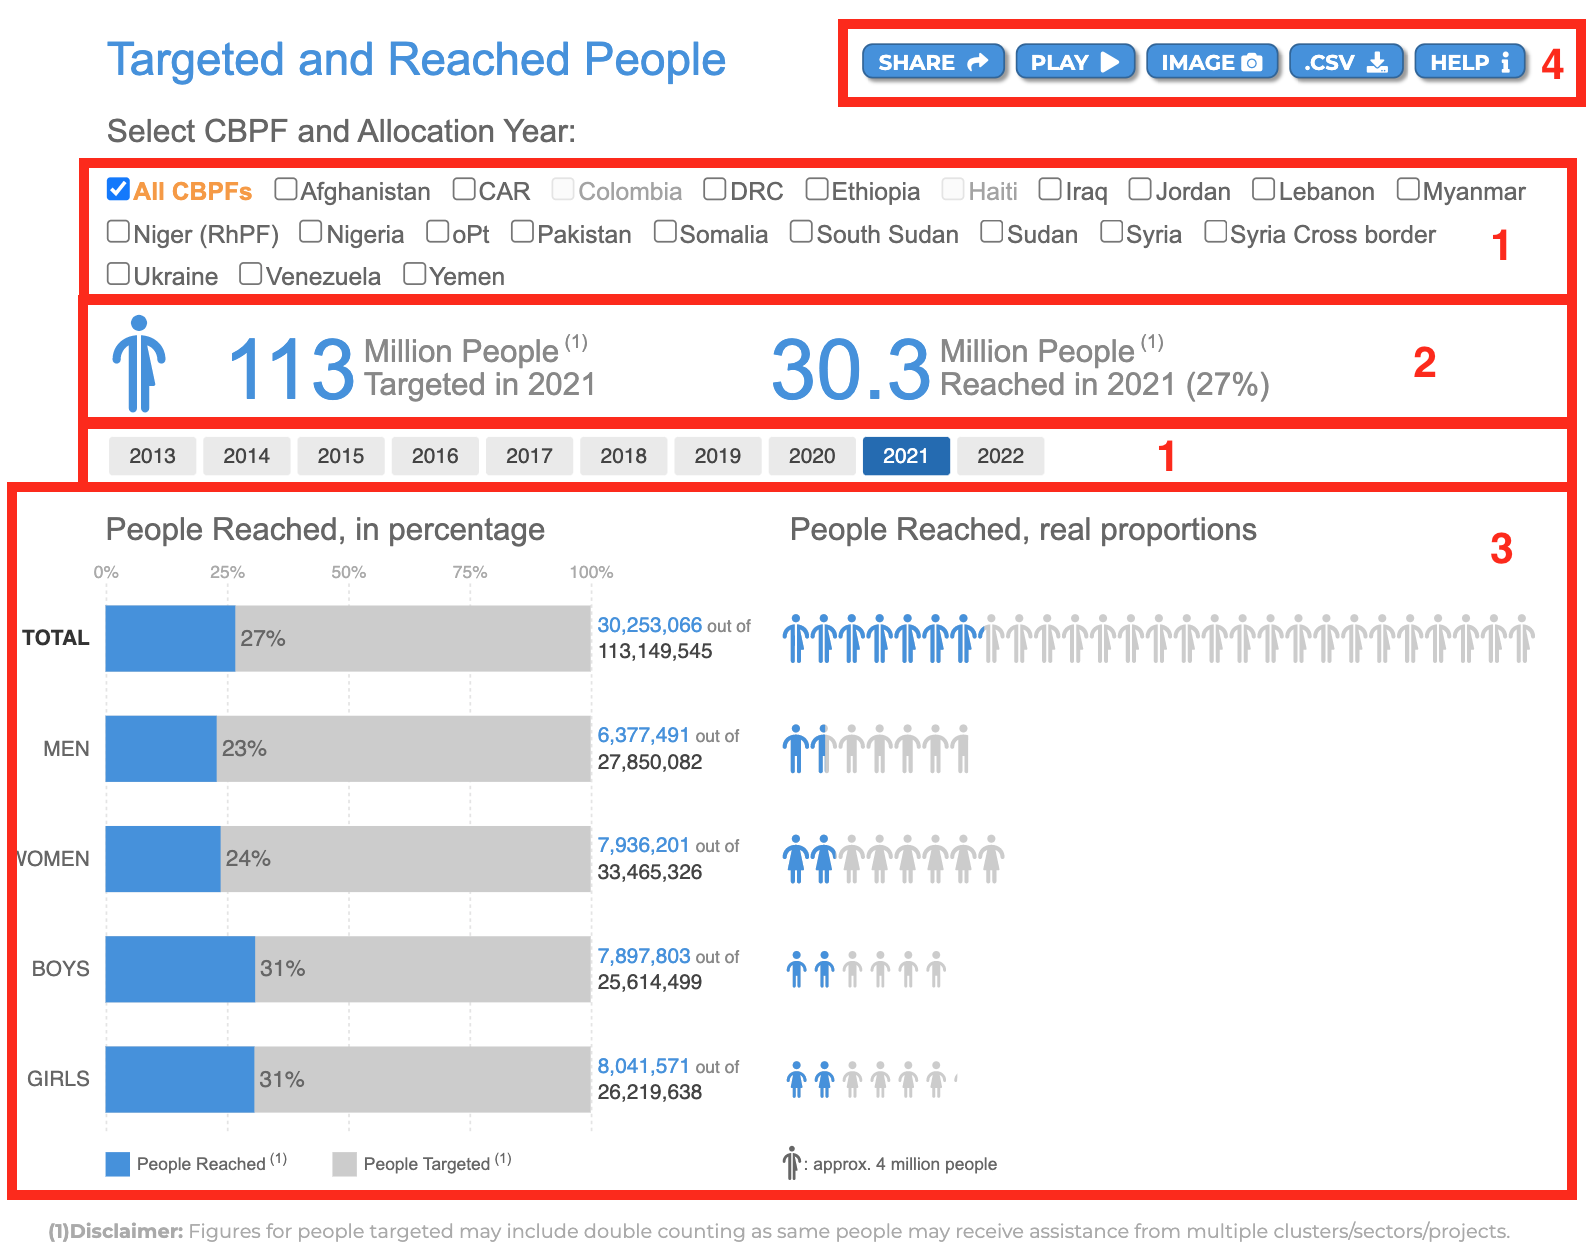
Please see below the description of fields 1-4 as annotated in red in the screenshot above.
-
The filters option: users can apply these filters to personalise the data.
CBPF: the user can select one or several CBPFs.
Year: the user can select one allocation year by clicking on it, or multiple allocation years by double clicking on them. -
The Allocations’ key figures: they reflect the filters applied, and give the following information:
The total number of people targeted in a given allocation year.
The total number of people reached in a given allocation year. -
The graphs: provide an overview of the amount of people targeted vs. reached.
-
The usual CBPF Data Hub tooltips: Share, Play, Image, .CVS, and Help. To know more about these tooltips, please click here.
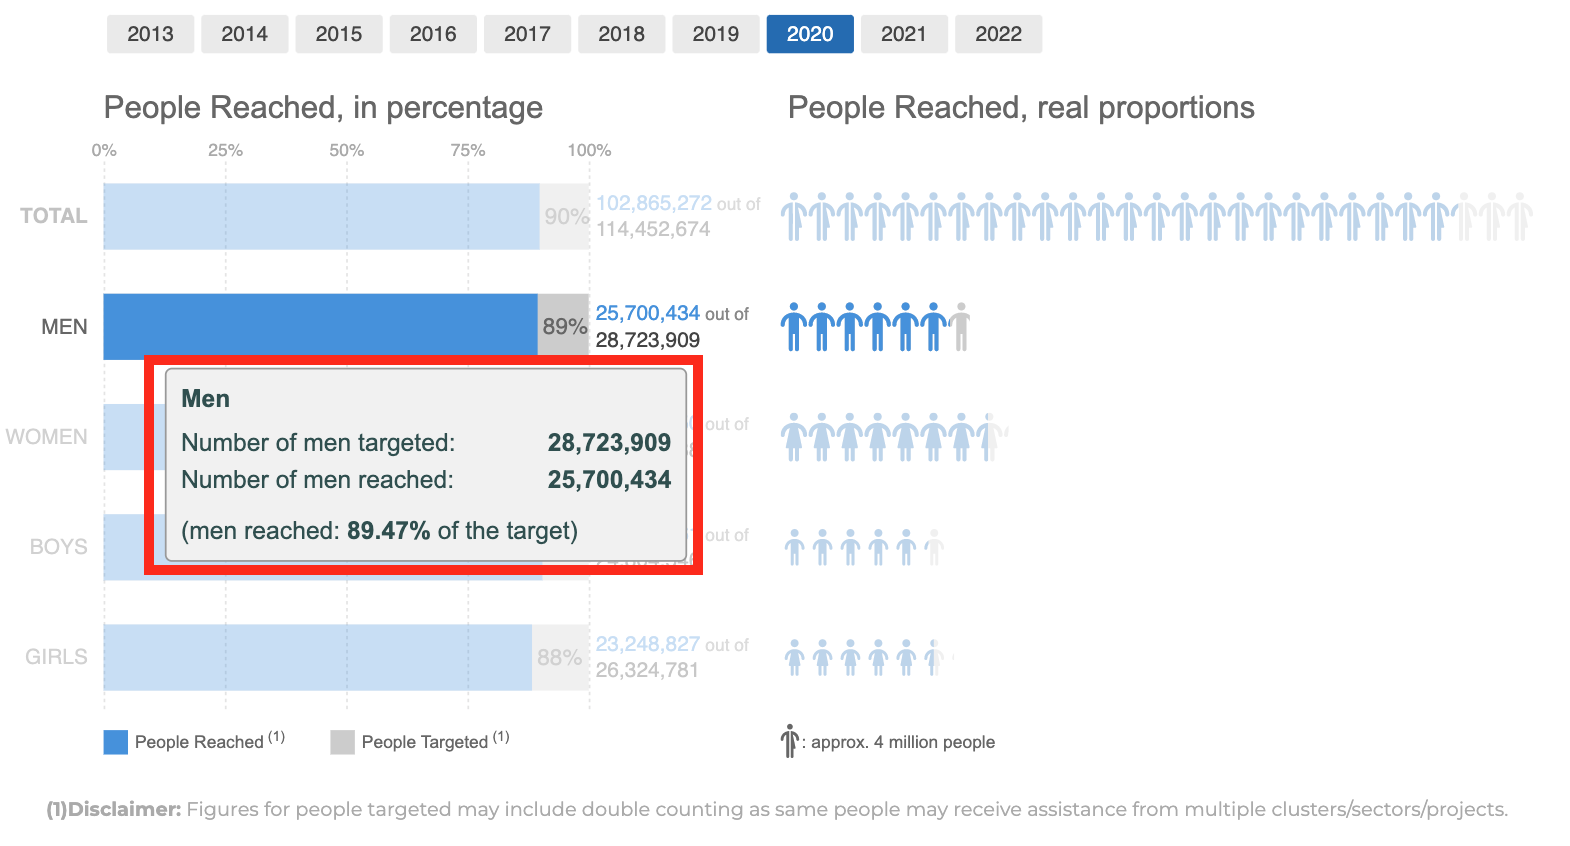
Hover over one of the breakdowns to display its tooltip, which provides information on:
- The number of people targeted.
- The number of people reached.
- The percentage of people reached in relation to those targeted.