- What is the Global Milestones module on GMS?
- How to access the Global Milestones module?
- How to use and read this tool?

- How to extract the data (Excel Format)
I) What is the Global Milestones module on GMS? Top
The Milestones module on GMS gives users both a general and detailed overview of the most important stages in a project’s lifecycle.
The module provides the following features:
- Overview of the projects progress during various stages such as Review and Approval, Implementation, Reporting, Closure, and others.
- Indicators that show the number of days between important project stages, to allow users to monitor the timeframe of the funding process
- Global averages for indicators
The Milestones and their respective indicators are meant to draw the attention of GMS users (notably the HFU and CBPF Finance) to the timeframes of the funding process in a CBPF, or globally. The Milestones data allows HFUs to understand how long each project stage lasts and show their progress and work in important milestones of the project lifecycle.
The Milestones report is an effective tool for HFUs and HQ to track progress, identify lags, and support efficient review processes, disbursements, and other grant related work.
The Milestones report offers different filter options and can be split between Standard and Reserve Allocations.
The various terminologies used to define are:
- “Milestones” refer to the important stages in the life cycle of a project.
- “Indicators” give the number of days between certain milestones.
- “Stages” refer to the division of the life cycle (Beginning to End) of a project into 'Stages'.
At any point, the Country Office management can have access to how the office is performing in order to inform the Humanitarian Coordinator, Advisory Board, and other relevant CBPF stakeholders.
|
GMS FOCUS: WHAT IS THE DIFFERENCE BETWEEN GLOBAL MILESTONES AND CBPF MILESTONES? Both Global Milestones and CBPF Milestones modules provide the same functionality, the only difference is the scale of the data provided. While the CBPF Milestones report shows the data only for one specific country, the Global Milestones report allows for the selection of several countries (all countries that a user has access to in GMS will show in the filter option for Global Milestones). The Global Milestones module is available for CBPF Finance and CBPF Programme units on GMS (HQ teams). To learn more about the CBPF milestones, please refer to this article. The “Milestones”-Modules at both the country and global level consist of two tabs: “Global Averages” and “Dashboard”. |
II) How to access the Global Milestones module? Top
Available only to CBPF Finance HQ and FMSU, the Global Milestones module can be reached on the GMS following this navigation: Report > Report > Global Milestones
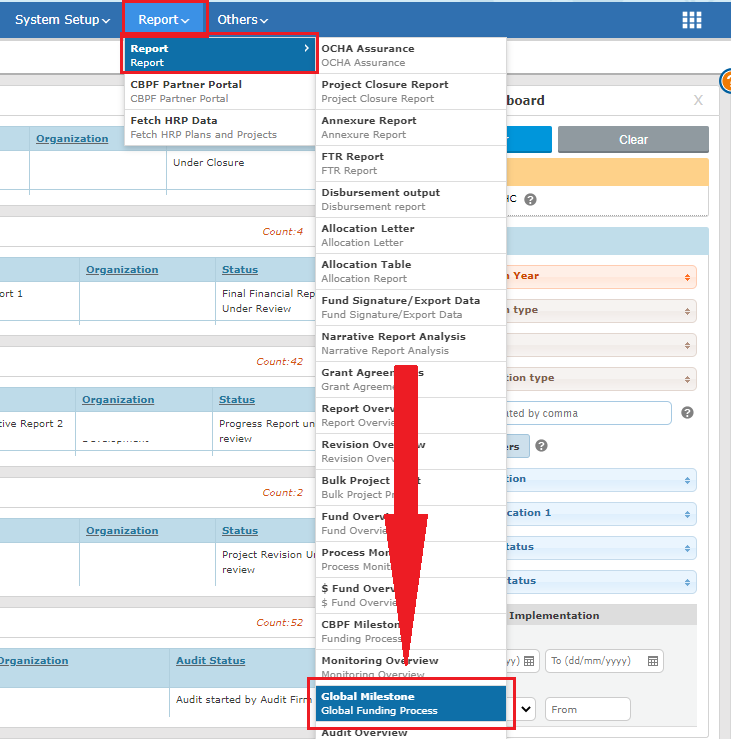
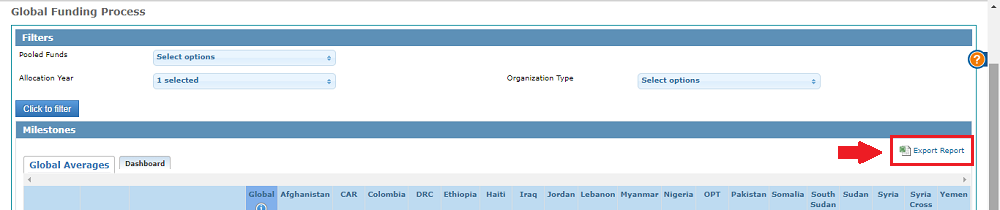
The screenshot below is the Global Funding Process, or Global Milestones page:
III) How to use and read the Global Milestones module? Top
The Global Averages tab gives a general overview of the most important project stages and milestones with indicators on the average duration between important milestones crossed by a project through its life cycle for both Standard and Reserve Allocations.
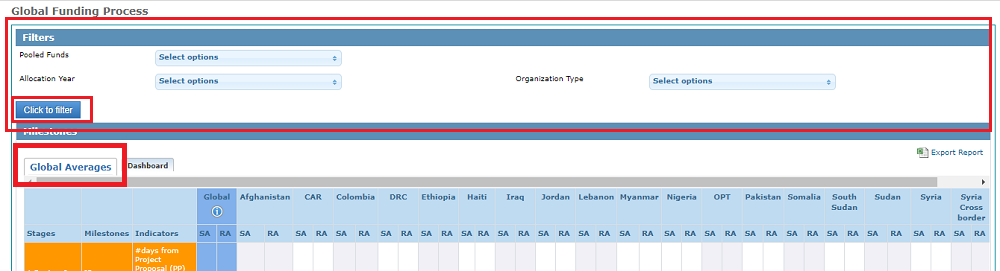
Filters’ Field description:
- Pooled Funds: Users can select one or several Pooled funds from the drop-down list.
- Allocation year: Users can select one or multiple Allocation year using the drop-down list.
- Organization Type: Users can select a specific organization type using the drop-down list.
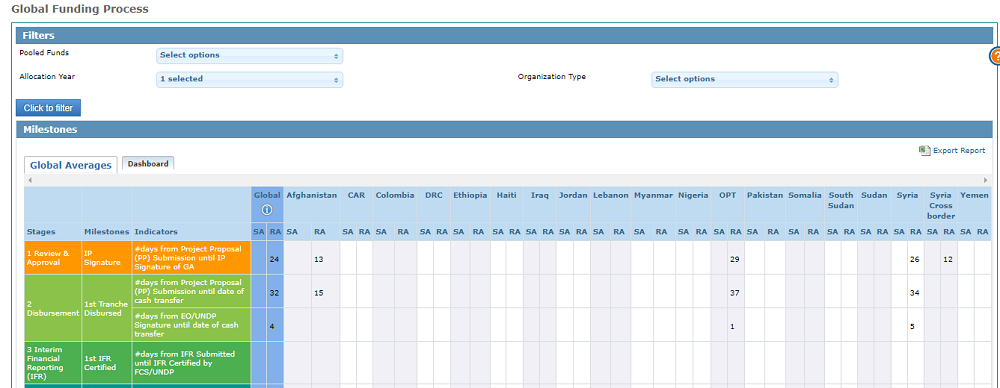
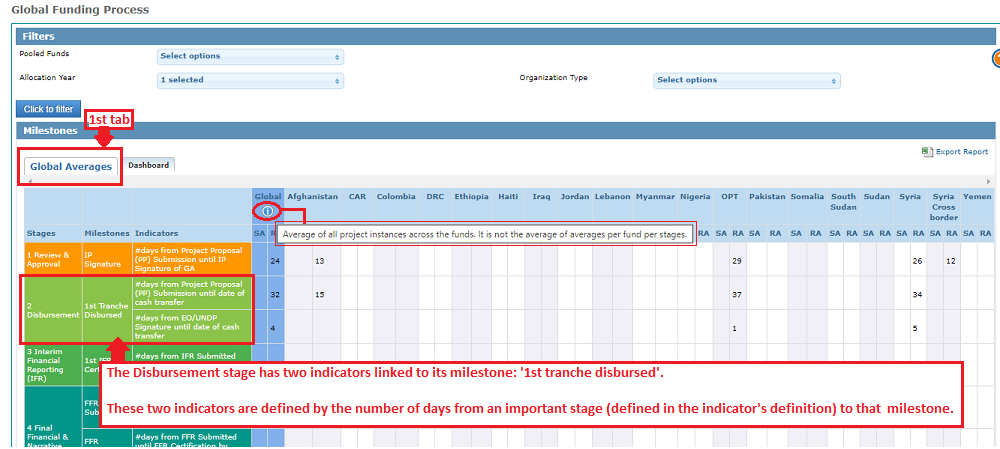
The Global averages tab displays a general overview of all stages, milestones and indicators and provides the average duration between important milestones crossed by a project through its life cycle for a both Standard Allocations (SA) and Reserve Allocations (RA), OF ALL POOLED FUNDS selected in the filter’s section.
How to read the Global Averages tab:
The below screenshot is taken from the staging platform (that includes dummy data).
In Afghanistan, it took on average 13 days for RA projects to go from Project Proposal Submission to IP signature.
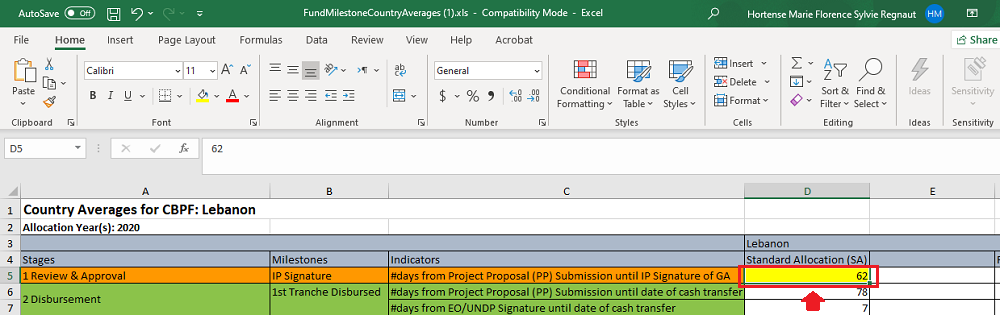
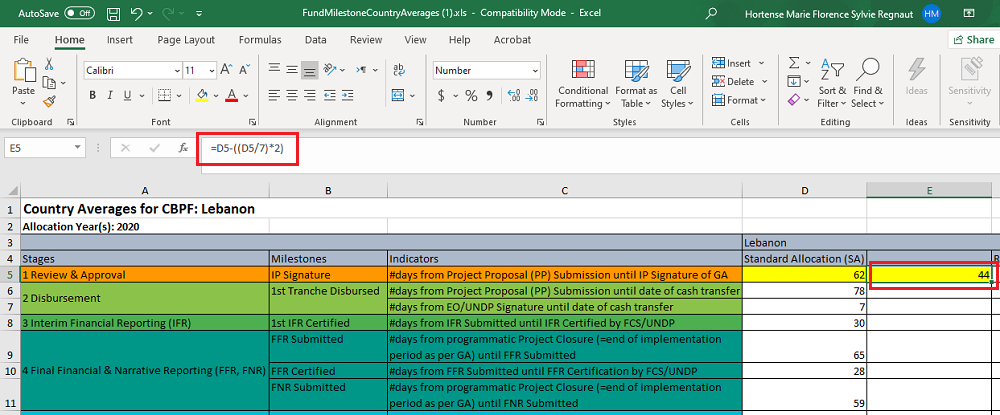
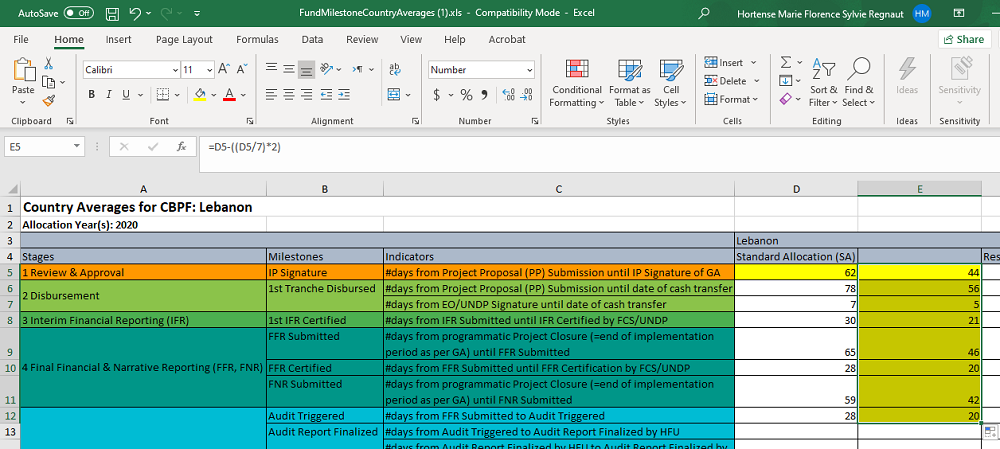
*Please note, the number of days displayed in this module is in terms of calendar days and not working days. Exporting the data on Excel can allow HFUs to apply the relevant formula to convert calendar days to working days.
To learn how to extract the data of this table as an Excel sheet, please refer to this section.
To learn how to convert calendar days into working days on Excel, please read our GMS tip available HERE.


More details on the elements of this tab are provided in the screenshot below:
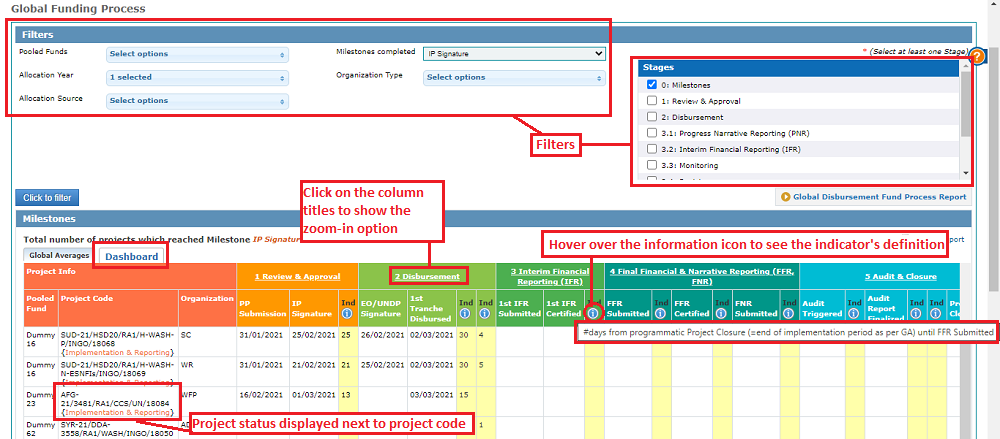
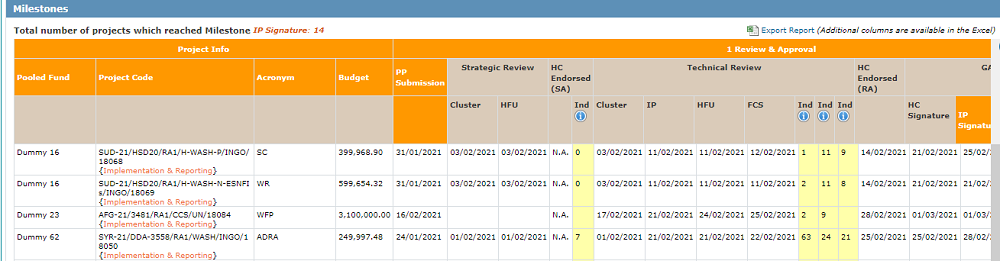
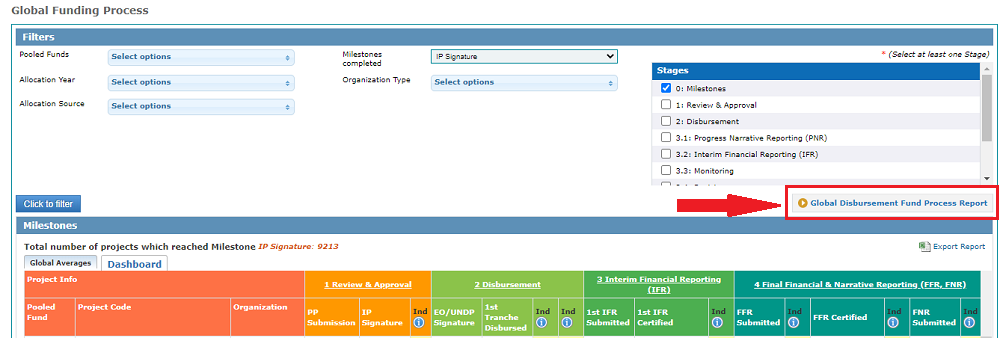
The Dashboard tab displays all projects on the GMS that have completed the milestone/project stage selected in the filters, along with their respective organization name, and provides the dates of each milestones’ completion, as well as several indicators which display the number of days between two important milestones.
The screenshot above shows the Dashboard for the full Milestones (all stages overview), i.e. when users DO NOT select a specific stage from the stage box (for more information on the stage box and the zoom in options, please click HERE.)
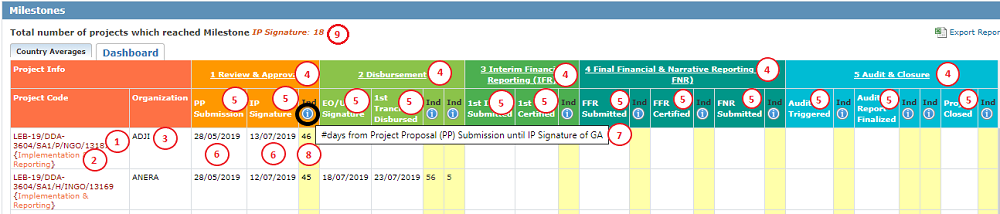
- Project code
- Project current workflow status
- Implementing Organization’s name
- Stages
- Milestones
- Date of milestone completion (a blank space could mean that the project has not yet reached this milestone)
- Indicator’s description (hover over the info tooltip
 to access it)
 - Indicator’s value (in number of calendar days)
- Total number of projects which reached the Milestone selected in the filters and are included in the report generated.
The default view displays figures of the 0: Milestones (overall) stage, for the current year and all Agency Types, clusters, Standard and Reserve Allocations (Only applicable if no filters have been selected on the Global Averages tab). However, the filter section of the dashboard tab enables users to select multiple variables that will be applied to the dashboard appearing below the section.
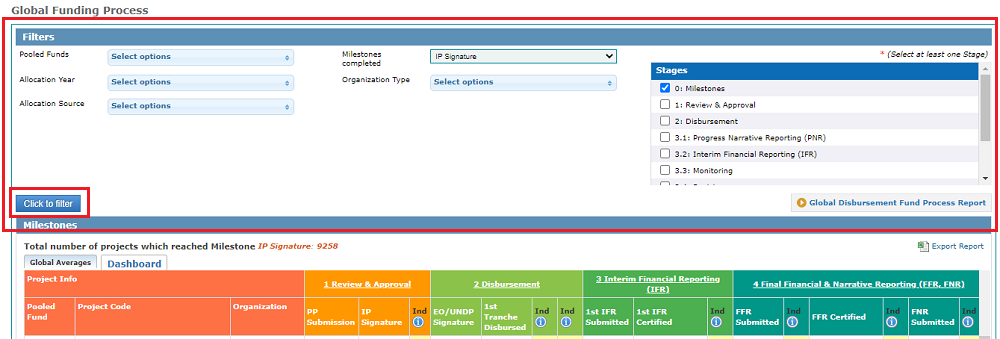
Filter Field’s Description:
- Pooled Funds: Users can select one or several Pooled funds from the drop-down list.
- Allocation year: Users can select one or multiple Allocation year using the drop-down list.
- Allocation Source: Users can select one or multiple allocation source using the drop-down list.
- Milestones completed: Users can select one specific milestone in the drop-down list. This field should show the minimum milestone that a project must have passed in order to be shown in the dashboard.
- Organization type: Users can select a specific agency type using the drop-down list.
The Global Milestones module provides detailed information on the path and progress of a project in the system as well as the action taken by the various stakeholders.
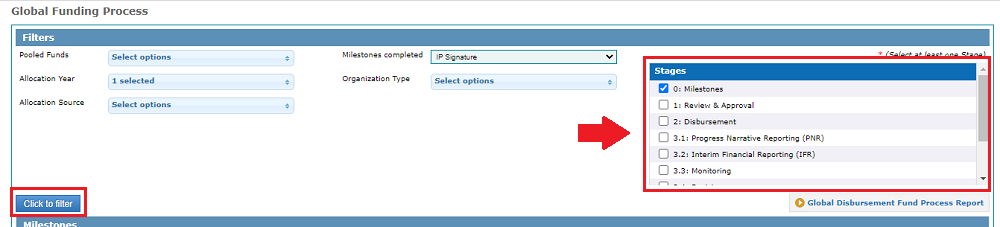
Zoom-in stages can be accessed by ticking the boxes in the ‘stages’ box of the filter section.
After selecting a stage from this Stages box, click on [click to filter].
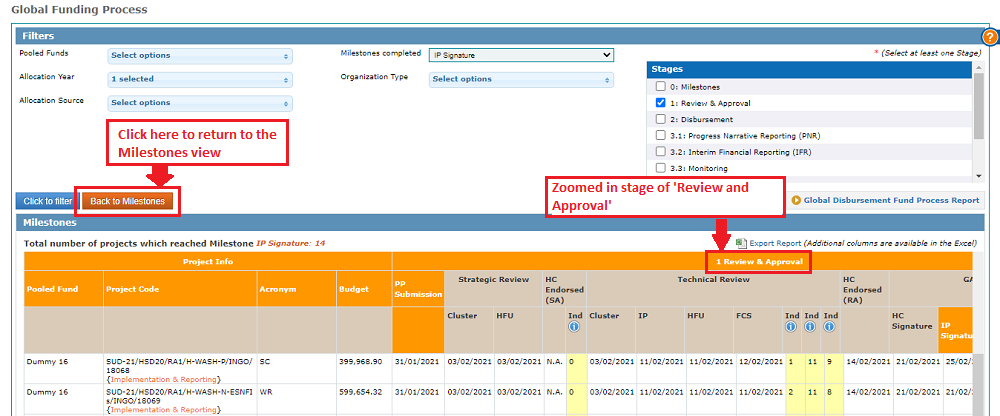
You can exit the zoom-in view by clicking on [Back to Milestones].
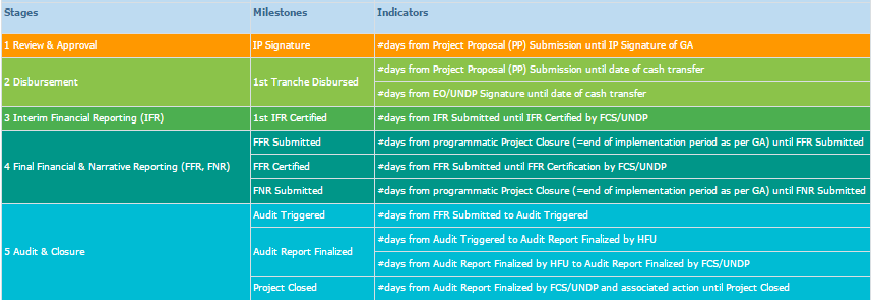
A brief overview of the Stages, milestones available in the funding process is given below.
- 1. Review & Approval Stage
- 2. Disbursement Stage
- 3.1 Progress Narrative Reporting (PNR)
- 3.2 Interim Financial Reporting (IFR)
- 3.3 Monitoring
- 3.4 Revision
- 4. Final Financial & Narrative Reporting (FFR, FNR) Stage
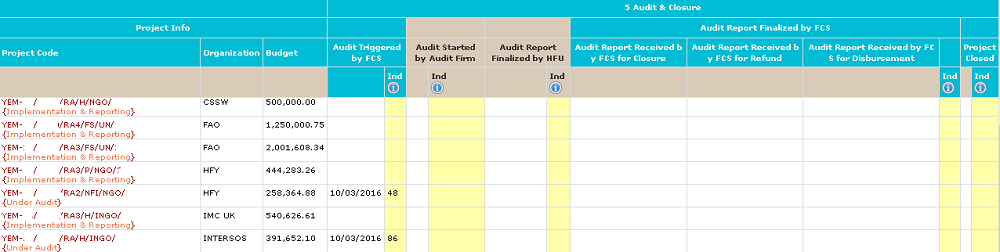
- 5. Audit & Closure Stage
Provides details from Project Proposal Submission to GA Signature process.
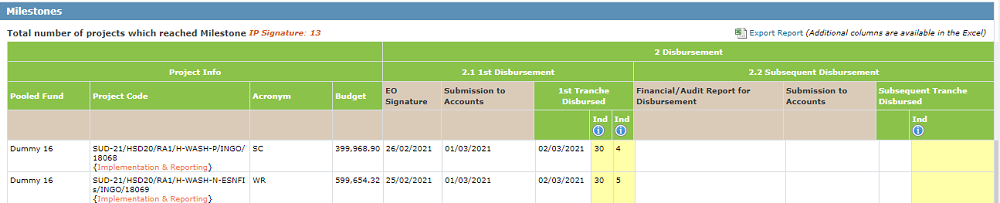
Provides with the details of the 1st Tranche disbursement and subsequent disbursements for each project.
*Please note, to view more information related to disbursement, you can generate a Global Disbursement Process Report, which includes, in addition to the information displayed here, info on all disbursement tranches as well as the average number of days for disbursement processing.
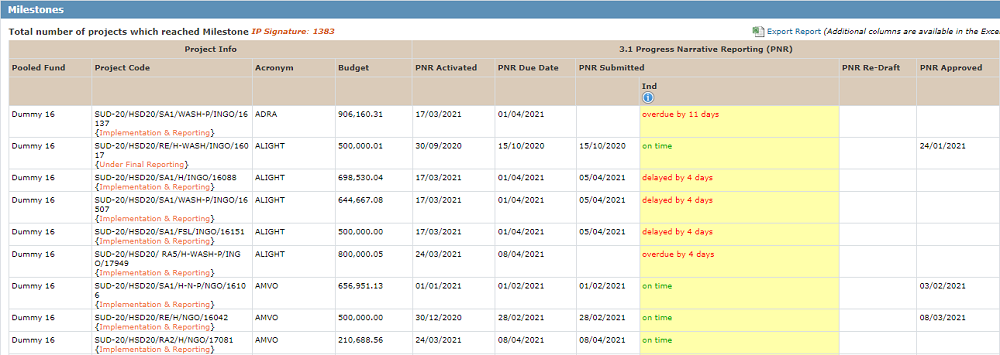
3.1 Progress Narrative Reporting (PNR)
There are three types of indicators used in Progress Narrative Reporting (PNR)
- On time – means report submitted on time.
- Delayed by XX day – means report submitted XX days after the due date saved in the project’s Timelines.
- Overdue by XX days – means report not yet submitted even after XX days from the due date saved in the project’s Timelines.
- Due in XX days – means XX days remaining till the due date for the report to be submitted.
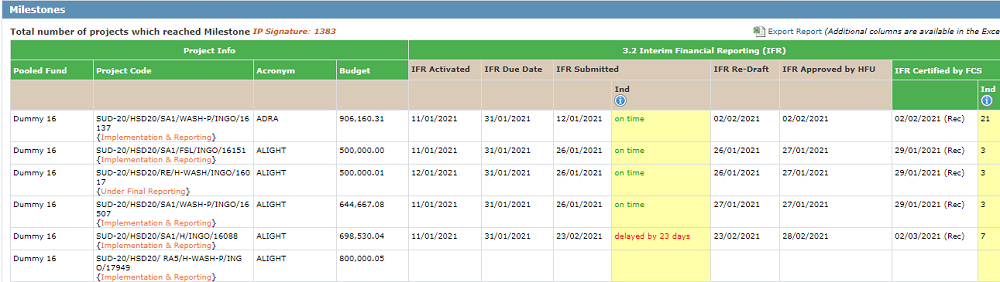
3.2 Interim Financial Reporting (IFR) Stage
There are four types of indicators used in Interim Financial Reporting (IFR)
- On time – means report submitted on time.
- Delayed by XX day – means report submitted XX days after the due date.
- Overdue by XX days – means report not yet submitted even after XX days from the due date.
- Due in XX days – means XX days remaining till the due date for the report to be submitted.
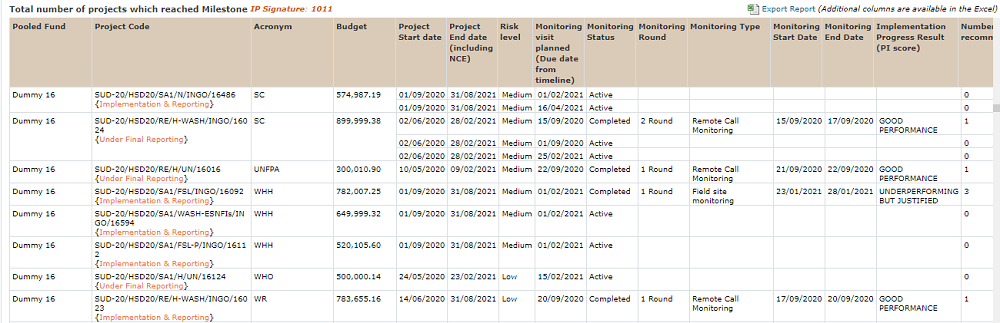
A brief overview of the monitoring types and details associated with individual projects are displayed in this stage.
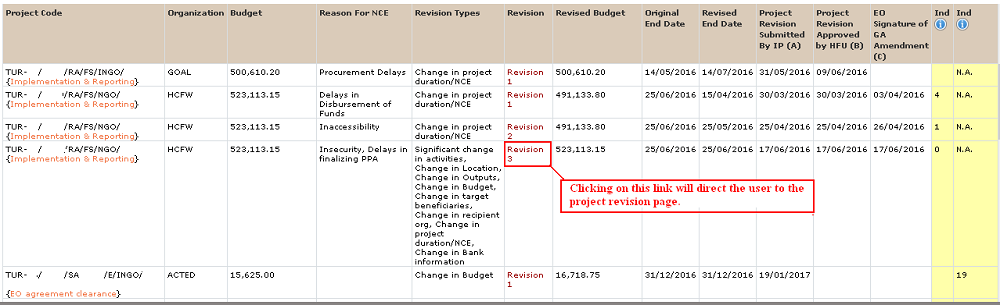
A brief overview of the revisions for individual projects are displayed in this stage. Clicking on the revision column data will direct the user to the project revision screen.
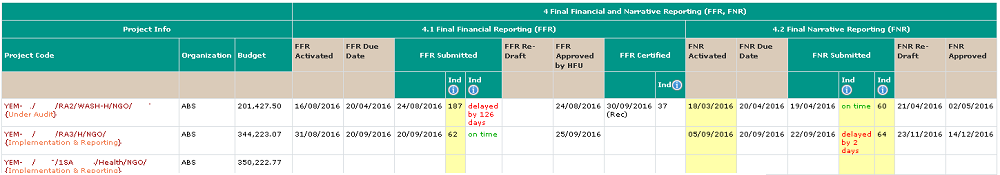
4. Final Financial & Narrative Reporting (FFR, FNR) Stage
There are four types of indicators used in Final Financial and Narrative Reporting (FFR & FNR)
- On time – means report submitted on time.
- Delayed by XX day – means report submitted XX days after the due date saved in the project’s Timelines.
- Overdue by XX days – means report not yet submitted even after XX days from the due date saved in the project’s Timelines.
- Due in XX days – means XX days remaining till the due date for the report to be submitted.
Provides details from Audit Triggered by CBPF Finance to Project Closure.
GLOBAL DISBURSEMENT PROCESS REPORT
The Global Milestones Dashboard also provides an access to the Global Disbursement Process Report.
To access the Global Fund Process Disbursement Report, click on [Global Disbursement Fund Process Report] from the Dashboard of the Global Milestones’ page.
To learn more on the Global Disbursement Process Report, please refer to this article of the GMS
IV) How to extract the data as an Excel sheet? Top
You can extract the raw data of all the aforementioned modules by clicking on the [Export Report] button located in the top right corner of the module’s visual.
We recommend extracting the data as an Excel sheet, especially if you applied filters, as the extracted excel document includes more information than what is provided in the visual on the GMS.