Once you have registered and logged in to the OneGMS, you will land on your home page tailored to your Agency. The home page is divided into three sections:
- Your Agency’s information
- Projects
- Project locations and Reports Overview

-
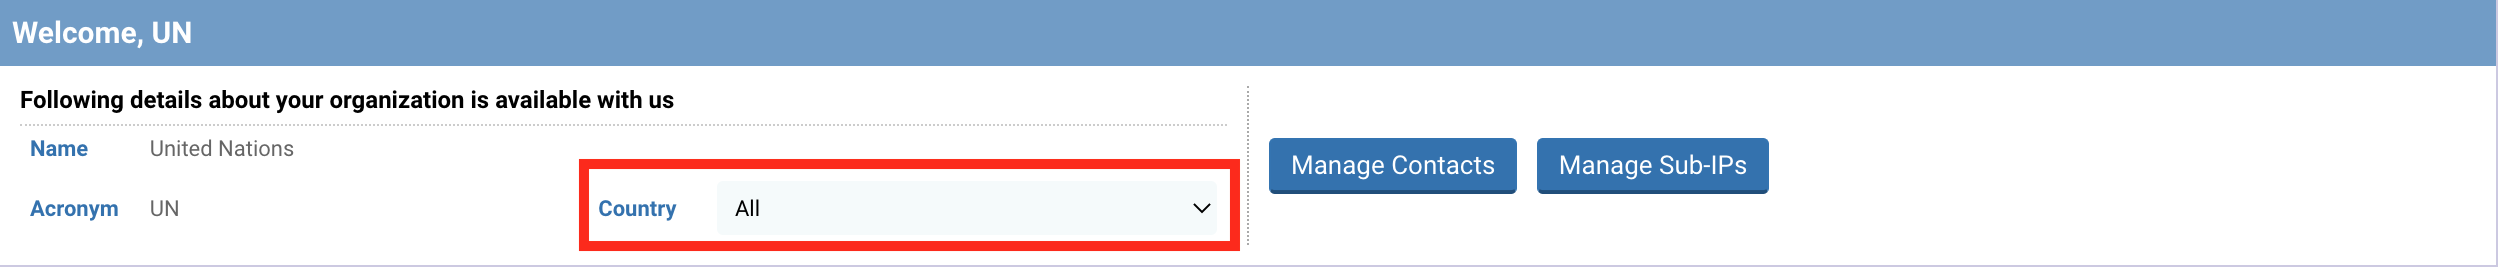
Your Agency’s information
At the top, you will find the name and acronym of your Agency. If you are registered in several countries, you can select from the drop-down list either all or one specific country to display projects linked to this country.
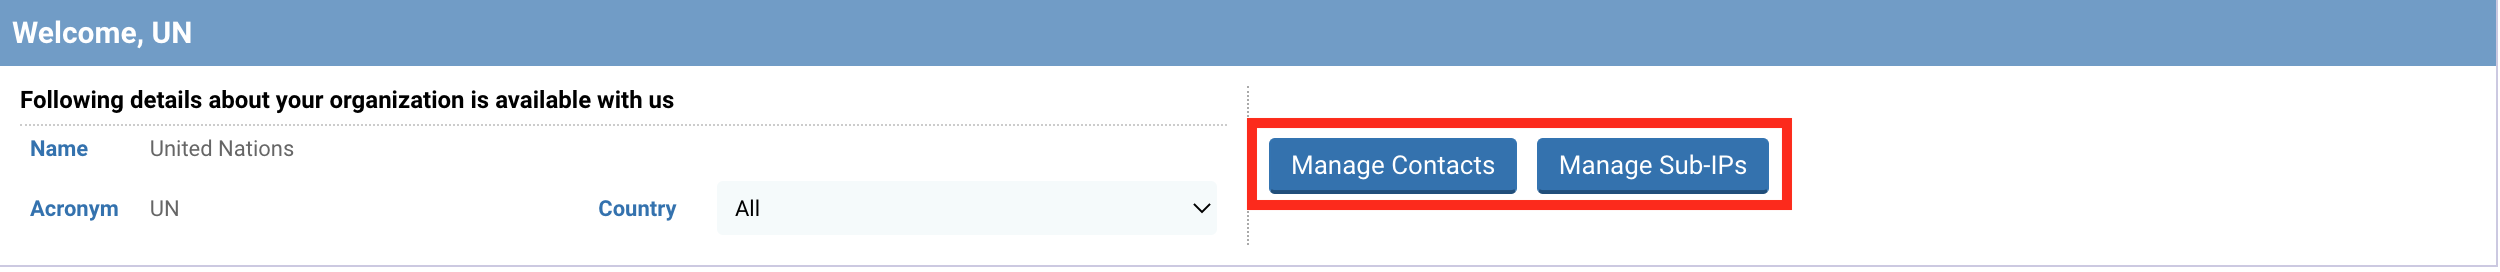
You can also directly access the Manage Contacts and the Manage Sub-IPs pages from your home page.
The ‘Manage Contacts’ page allows you to edit or add focal points against the allocation strategy and/or the project proposal. To do so click on [Manage Contacts]. If you want to read more about the Manage Contacts page, click here.
The Manage Sub-IPs page allows you to edit a sub-implementing partner’s information or to register a new one and link it to your project proposal. To access this page, click on [Manage Sub-IPs]. If you wish to read more about this page, click here.
-
Projects
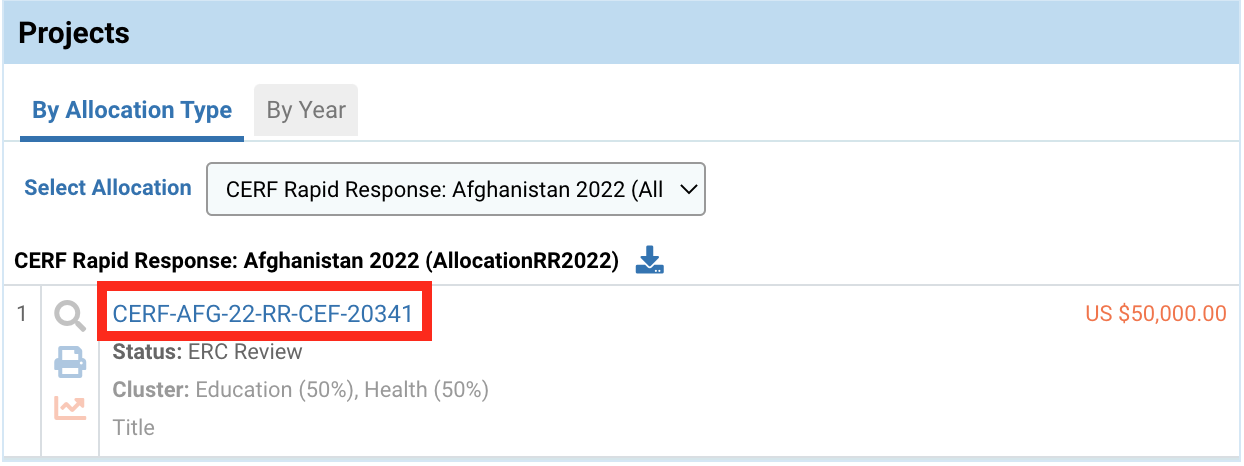
You can find in this section all your project proposals and sort them by allocation type or by year. For each project, information on the budget, status, cluster and title are provided.
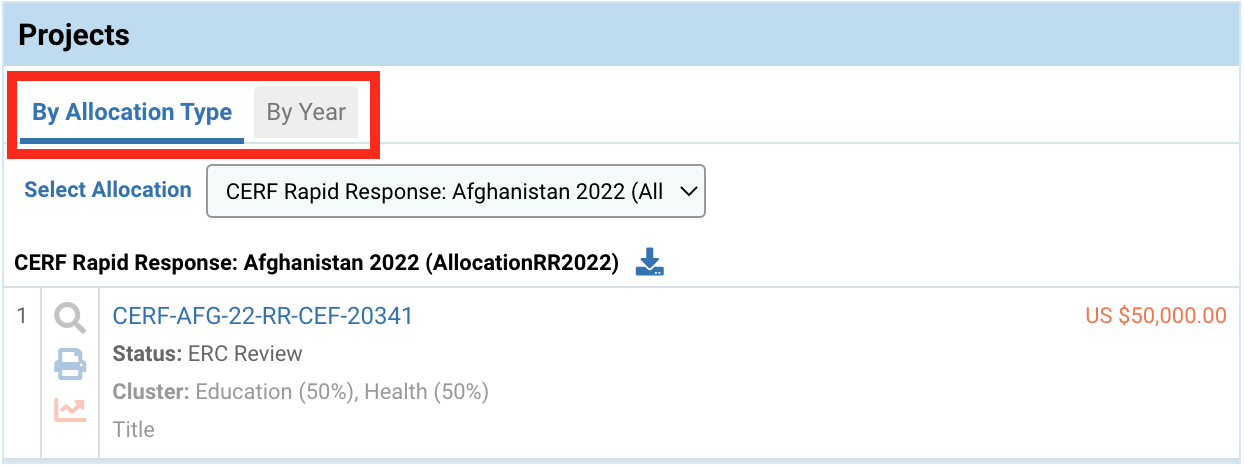
To open a project proposal, click on its project code.
On the left side of the table, you will find action icons that may vary depending on the stage of the project proposal.
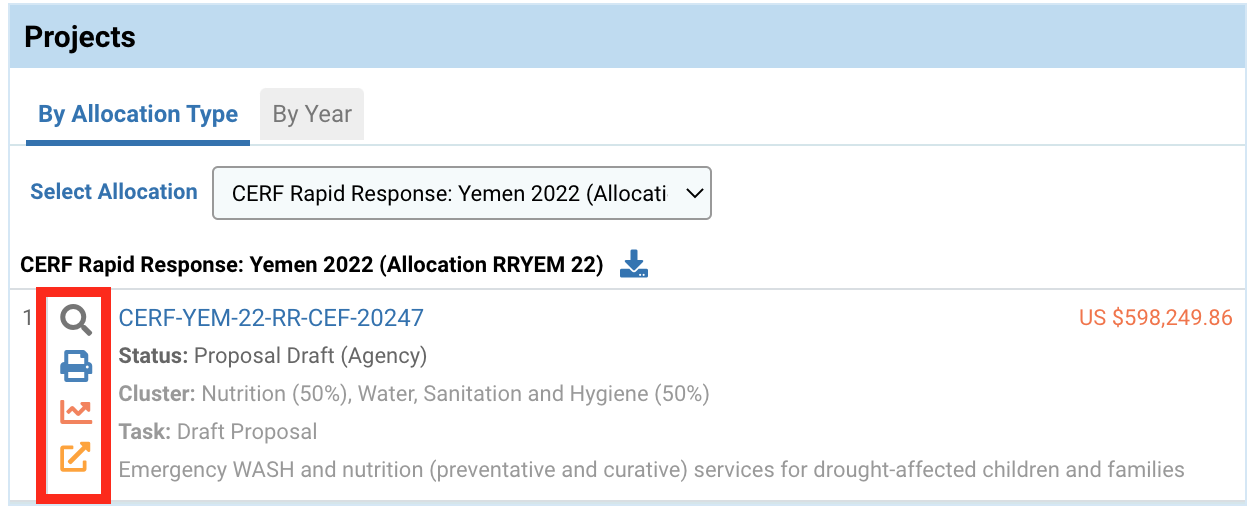
Click on this icon ![]() to open the project proposal. According to its stage, the project proposal can be in read-only mode or editing mode.
to open the project proposal. According to its stage, the project proposal can be in read-only mode or editing mode.
Click on this icon ![]() to print the project proposal.
to print the project proposal.
Click on this icon ![]() to open the project's workflow. The user will be able to see at which stage the project is and what are the next steps. (under construction)
to open the project's workflow. The user will be able to see at which stage the project is and what are the next steps. (under construction)
Click on this icon ![]() to open the task page. This icon will only be visible if you have a role to play in the workflow of the project at the given time.
to open the task page. This icon will only be visible if you have a role to play in the workflow of the project at the given time.
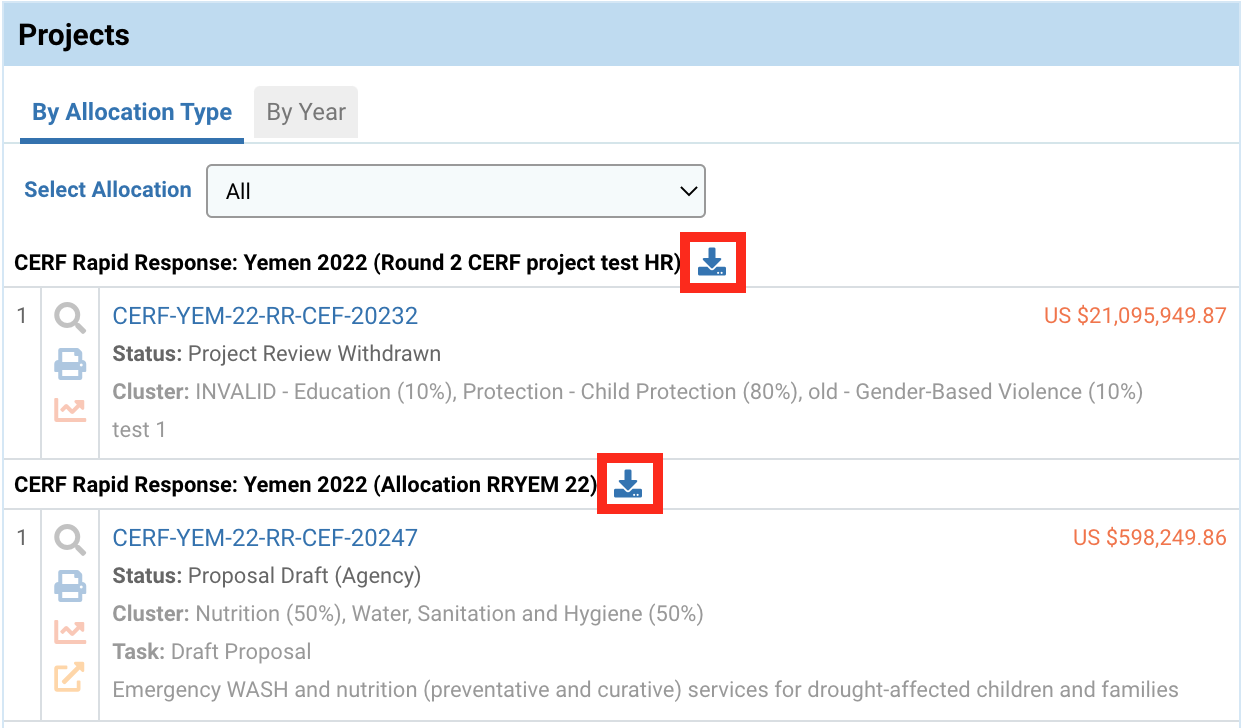
Finally, for each allocation you can click on this icon  to download the Allocation Type Documents.
-
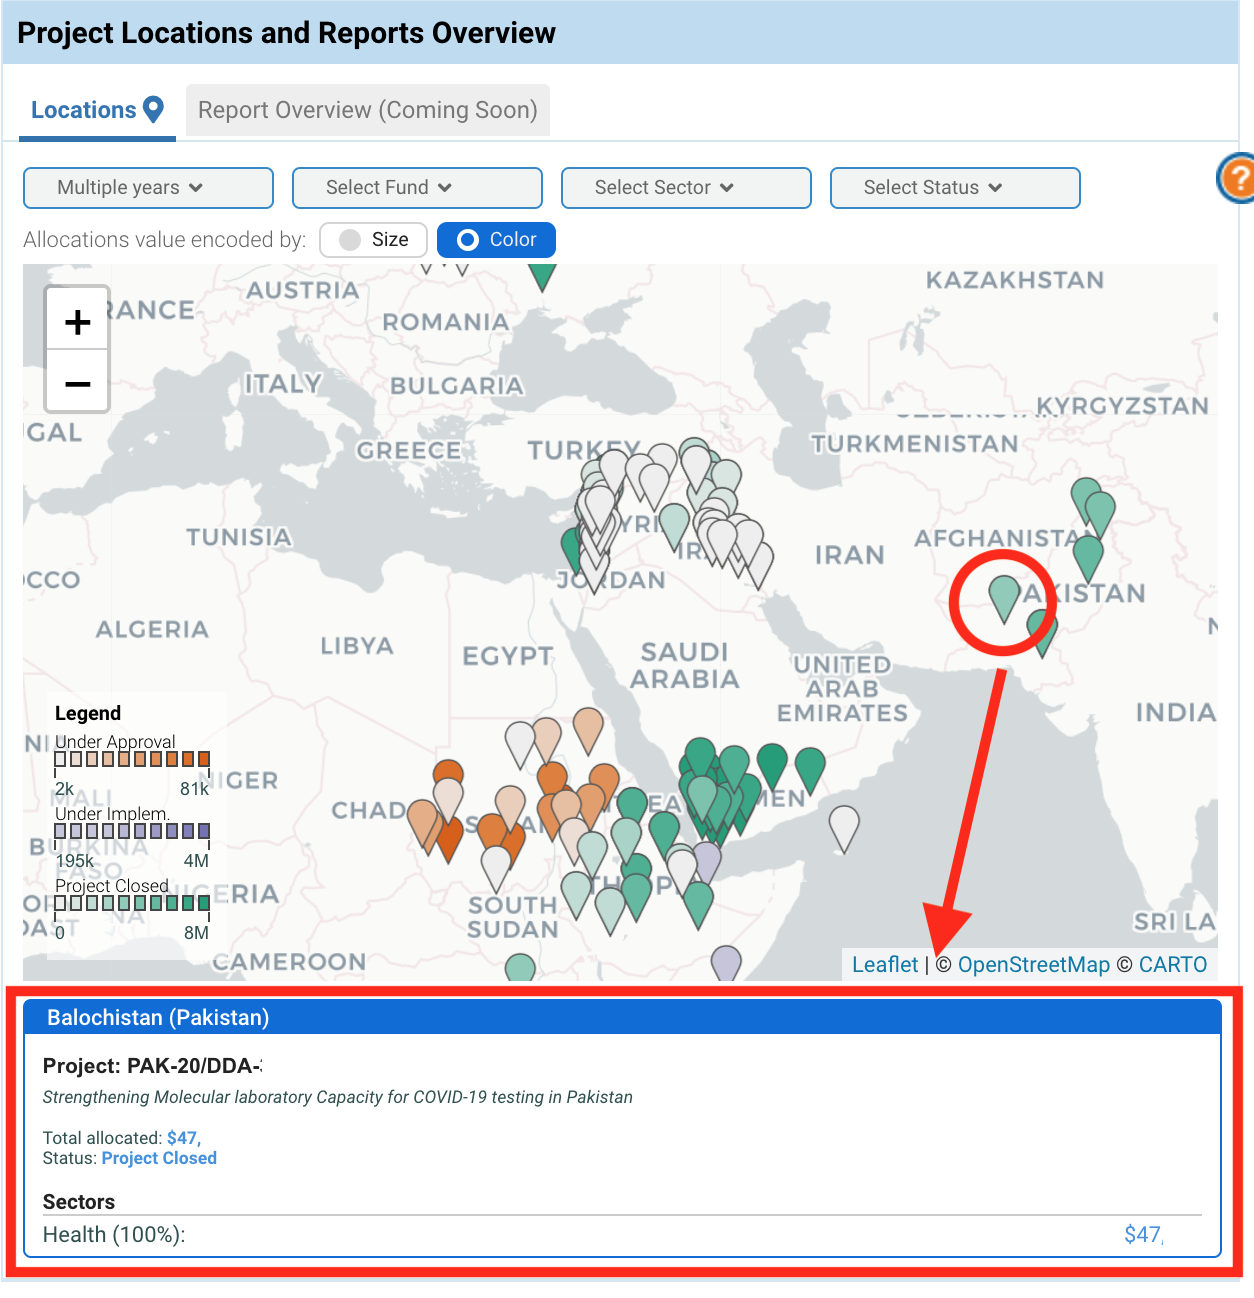
Project locations and Reports Overview
This section provides you with additional information on the locations of your projects and an overview of the different reports.
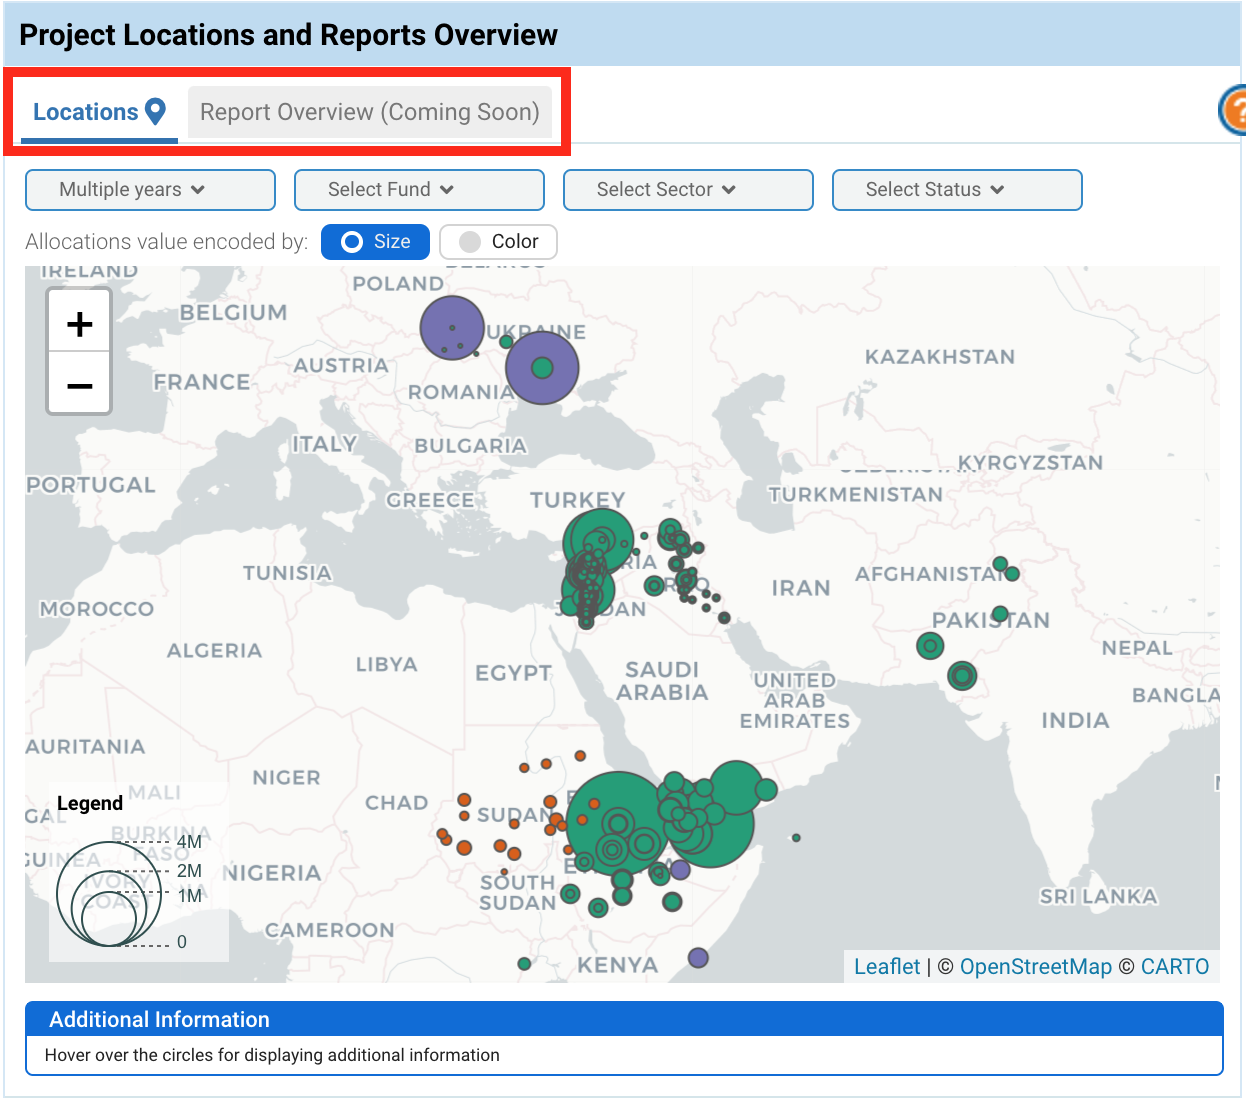
The ‘Locations’ tab displays the locations of all your projects on a map and provides additional information on your project(s). The size of the node represents the project’s budget and the colour the status of the project. In red are projects that are under approval, in purple are projects that are under implementation, and in green you’ll find the projects that are closed.
You can use the filters on the top to personalise the map. You will find below a description of each filter.
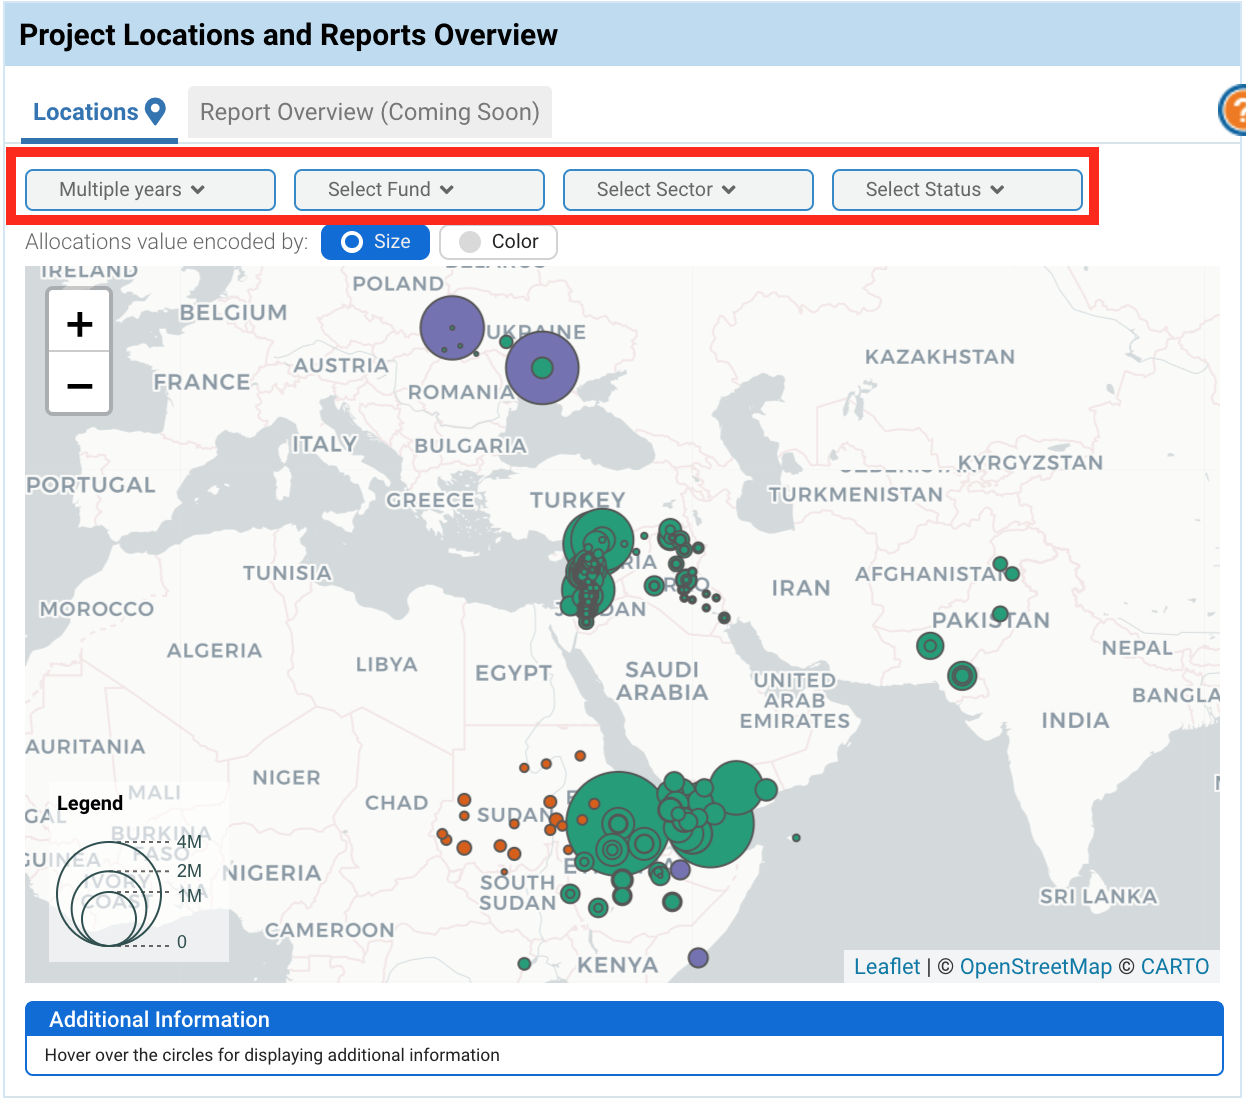
- Select Year: select one or several years.
- Select Fund: select one or several countries. Only countries where you have created a project for are displayed in the drop-down menu.
- Select Sector: select one or multiple sectors.
- Select Status: select one or several project’s status: under approval, under implementation or closed.
Project are represented according to their budget’s value. The budget can be either represented by the size of the nod, by clicking on [Size] (as in the screenshot hereinabove), or by a colour gradient by clicking on [Color] (as in the screenshot below).
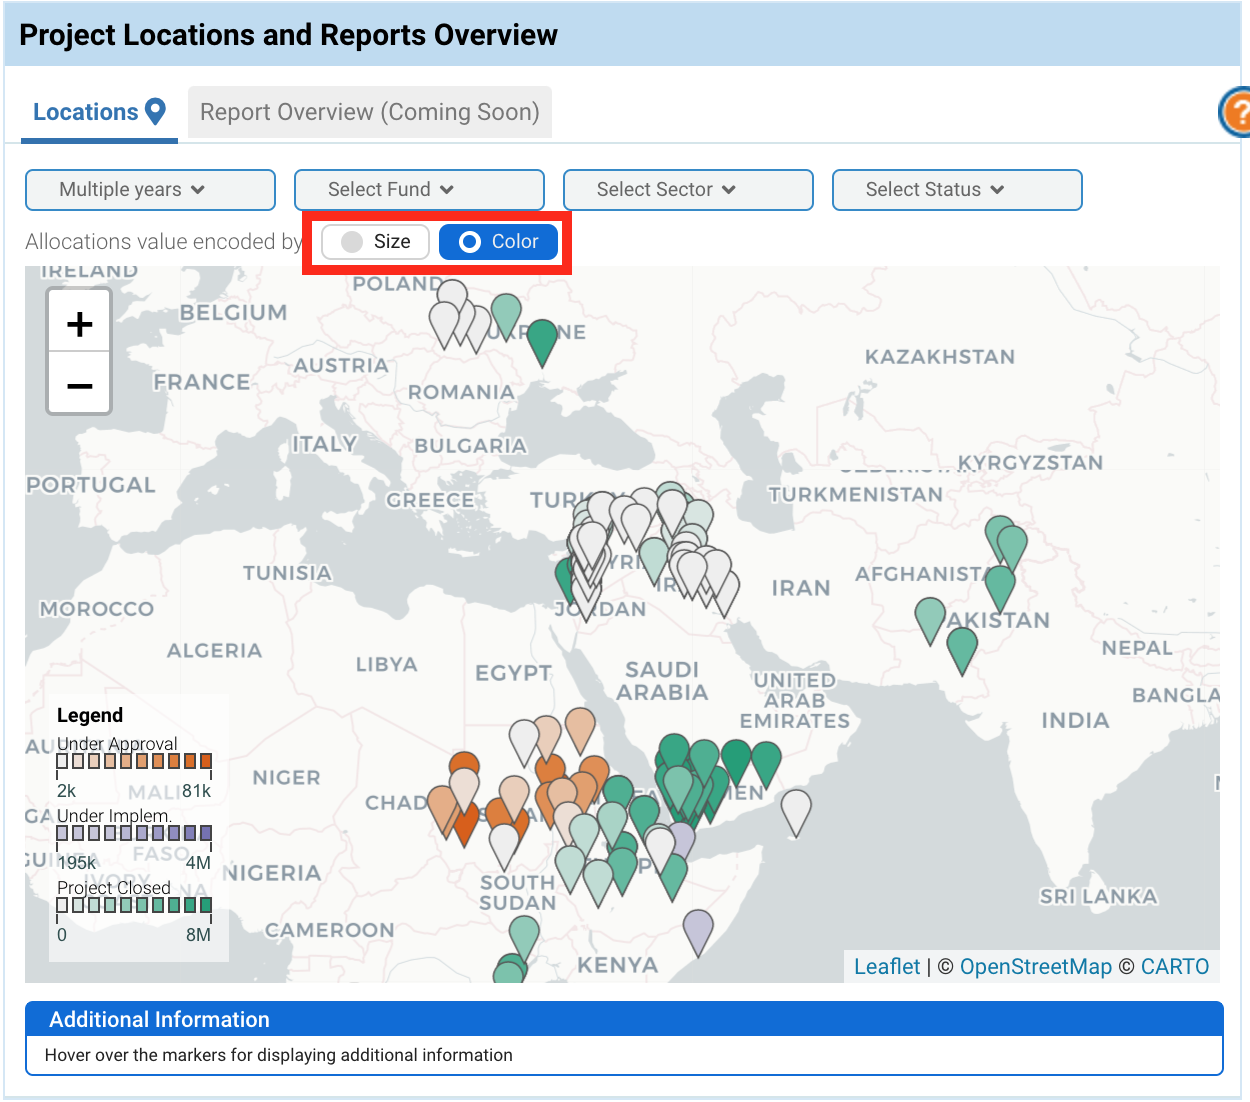
You can hover over a marker to display additional information on the project.