I) What are the different components of the infographic?
II) How to access the data?
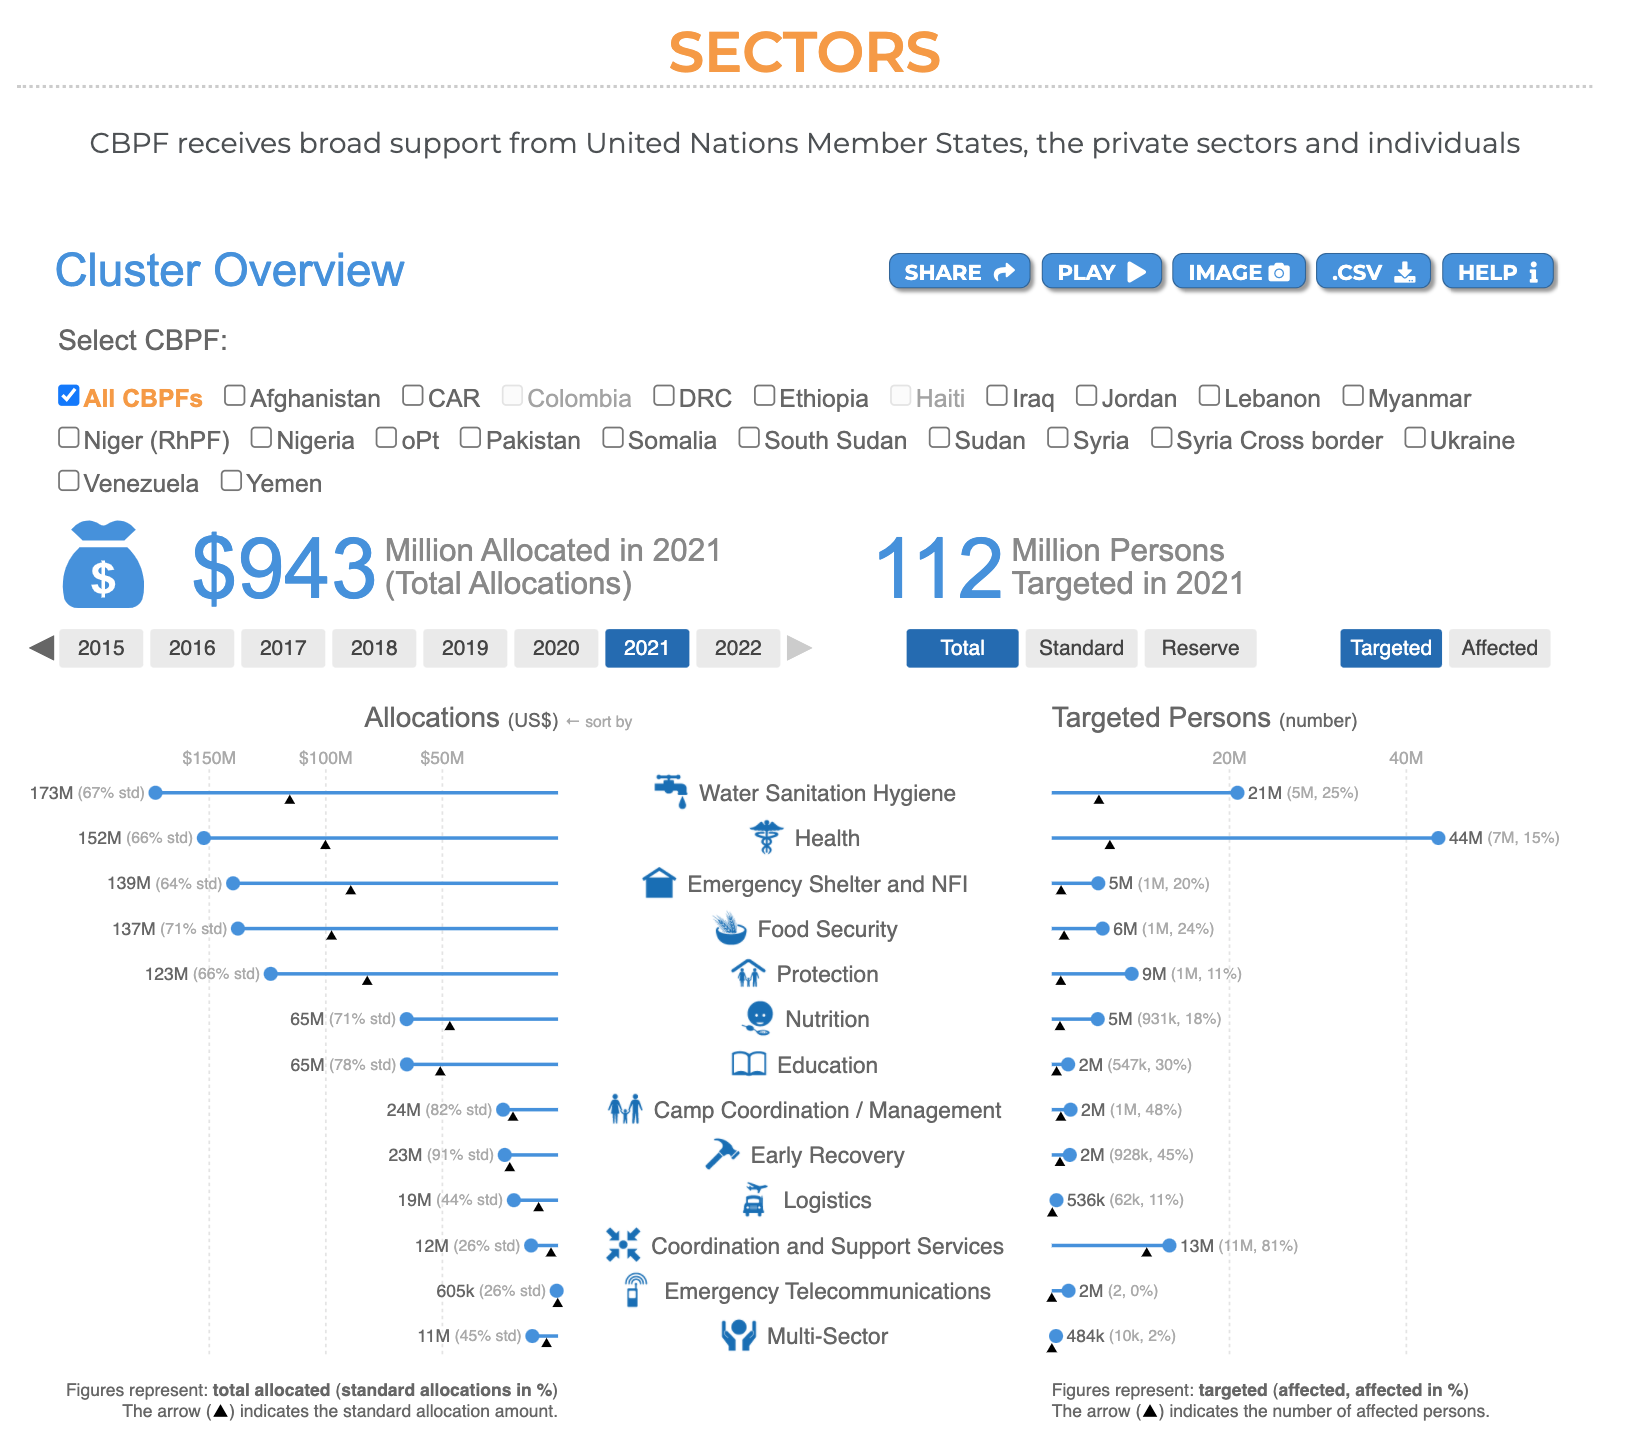
This visual informs the users on the sectors’ targets, achievements and fundings, according to the allocation year, the allocation type and the CBPF. The visualization shows not only the amount allocated by sector, but also the number of targeted and affected persons by sector.
I) What are the different components of the infographic?
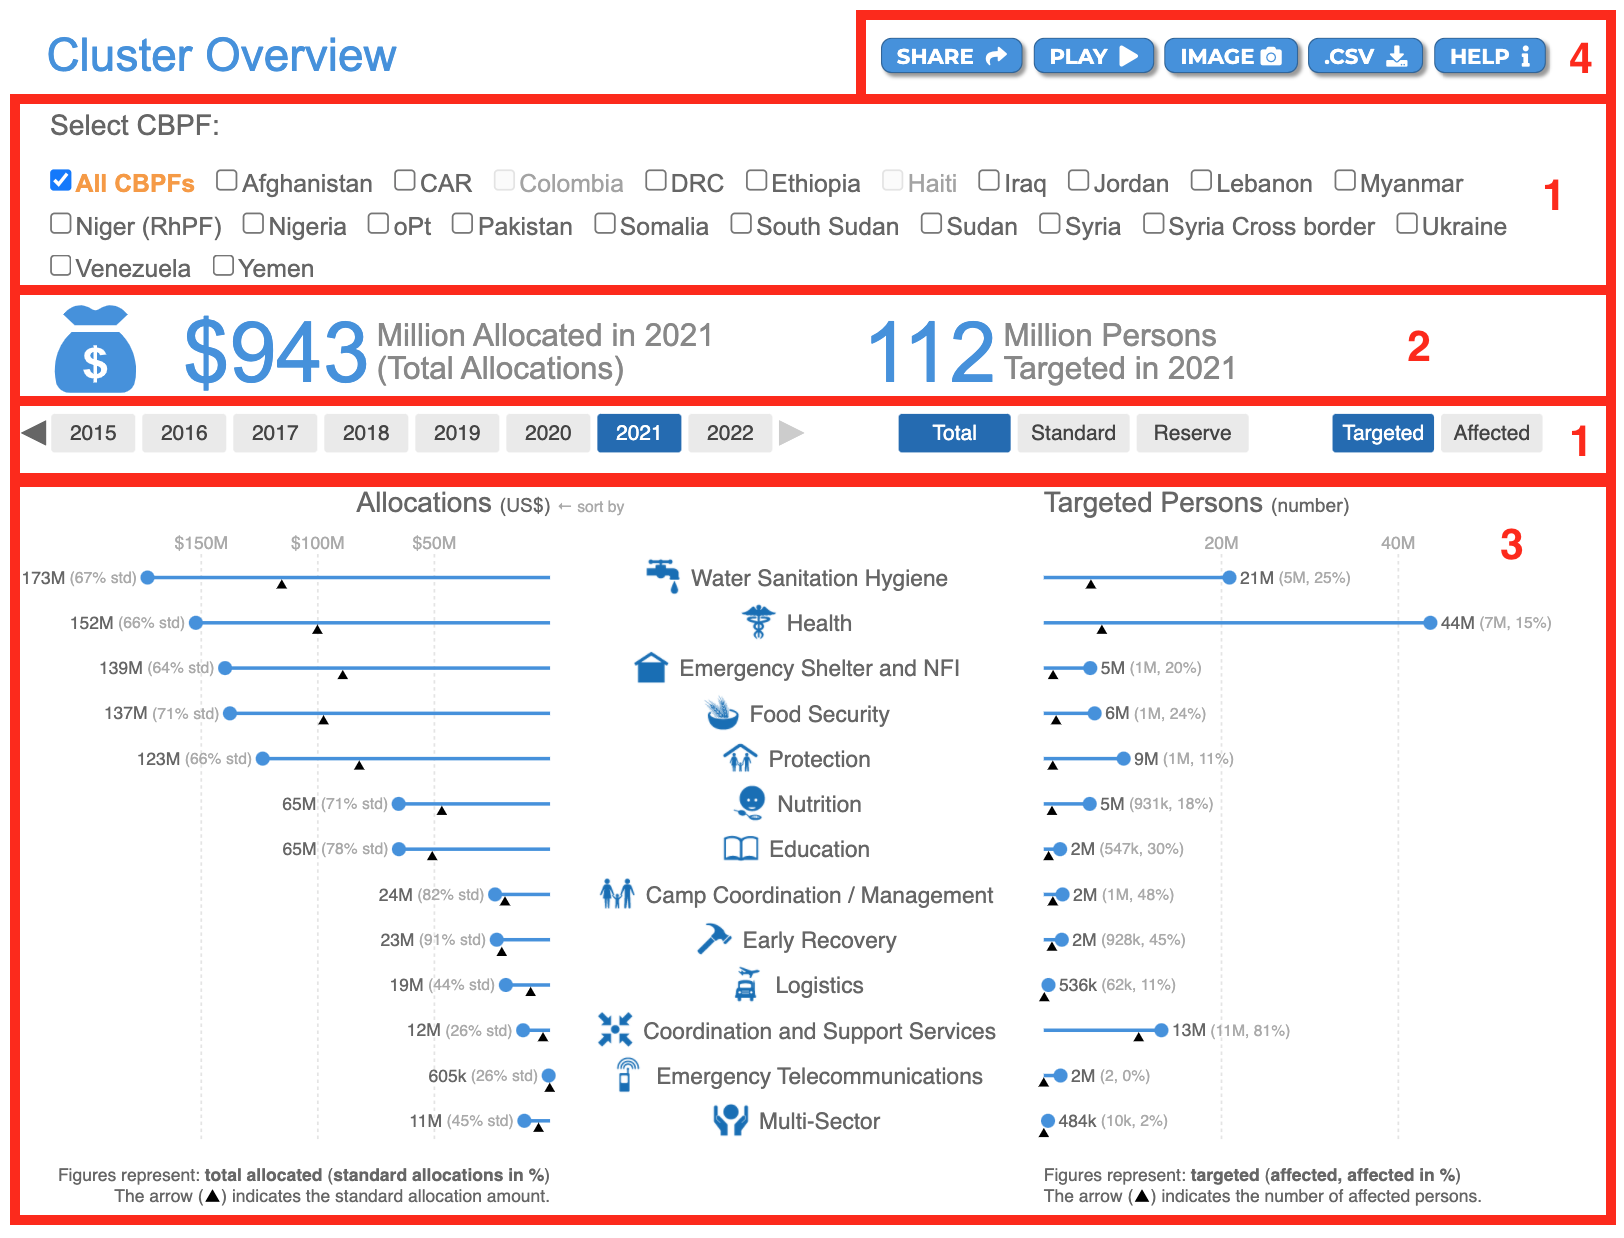
-
The filters option: users can apply these filters to personalize the data.
a. CBPF: users can select one, several or all CBPFs.
b. Year: users can select one allocation year by clicking on it, or several allocation years by double clicking on them.
c. Allocation: users can choose to display the Standard allocations only, Reserve allocations only or both by clicking on [Total].
d. Users can either display the number of Targeted persons or the number of Affected persons for each sector. -
The Allocations’ key figures: they reflect the filters applied, and give the following information:
a. The amount in USD allocated to all sectors in a given allocation year.
b. The number of the total persons targeted or affected. -
The bar chart: provides an overview of the amount allocated by sector and the number of targeted and affected persons by sector.
-
The usual CBPF Data Hub tooltips: Share, Play, Image, .CVS, and Help. To know more about these tooltips, please click here.
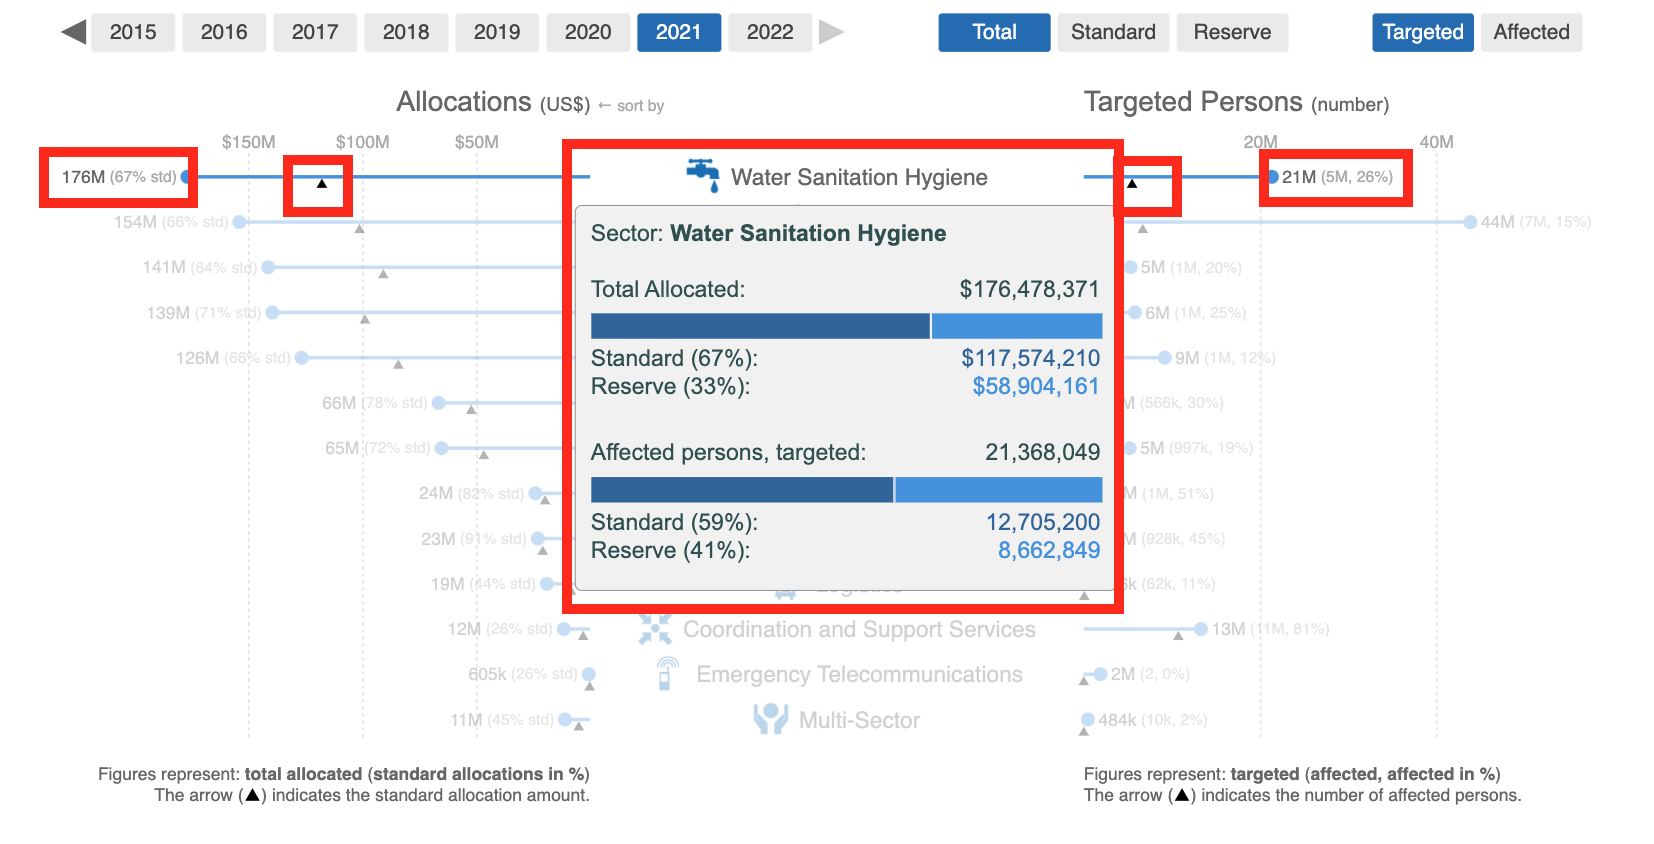
Hover over the sector to see its tooltip, which provides information on:
a. Total Allocated: the total amount in USD allocated to the selected sector.
b. Standard: the share and the amount in USD allocated for standard allocations to the selected sector.
c. Reserve: the share and the amount in USD allocated for reserve allocations to the selected sector.
d. Affected persons, targeted (when the “Targeted” filter is applied): the total number of targeted affected people for the selected sector.
e. Affected persons, actual (when the “Affected” filter is applied): the total number of actual affected people for the selected sector.
f. Standard: the share and total number of affected or targeted persons for standard allocations.
g. Reserve: the share and total number of affected or targeted persons for reserve allocations.
The “Allocations” bar chart shows the total amount in USD allocated to the sector and the percentage that went to standard allocations between brackets.
The arrow icon ![]() indicates the standard allocation amount.
indicates the standard allocation amount.
Please note: the share of standard allocations and the arrow icon will only be displayed if you have selected the filter “Total”.
The Targeted Persons bar chart shows the total number of targeted persons and the percentage of affected persons between brackets.
The arrow icon ![]() indicates the number of affected persons.
indicates the number of affected persons.
Please note: the number and percentage of affected persons and the arrow icon will only be displayed if you have selected the filter “Targeted”.