GMS Milestones
Content:
- WHAT IS THE MILESTONES MODULE ON GMS?
- HOW TO USE AND READ THIS TOOL?
- EXTRACT RAW DATA (Excel format)

WHAT IS THE MILESTONES’ MODULE ON GMS?
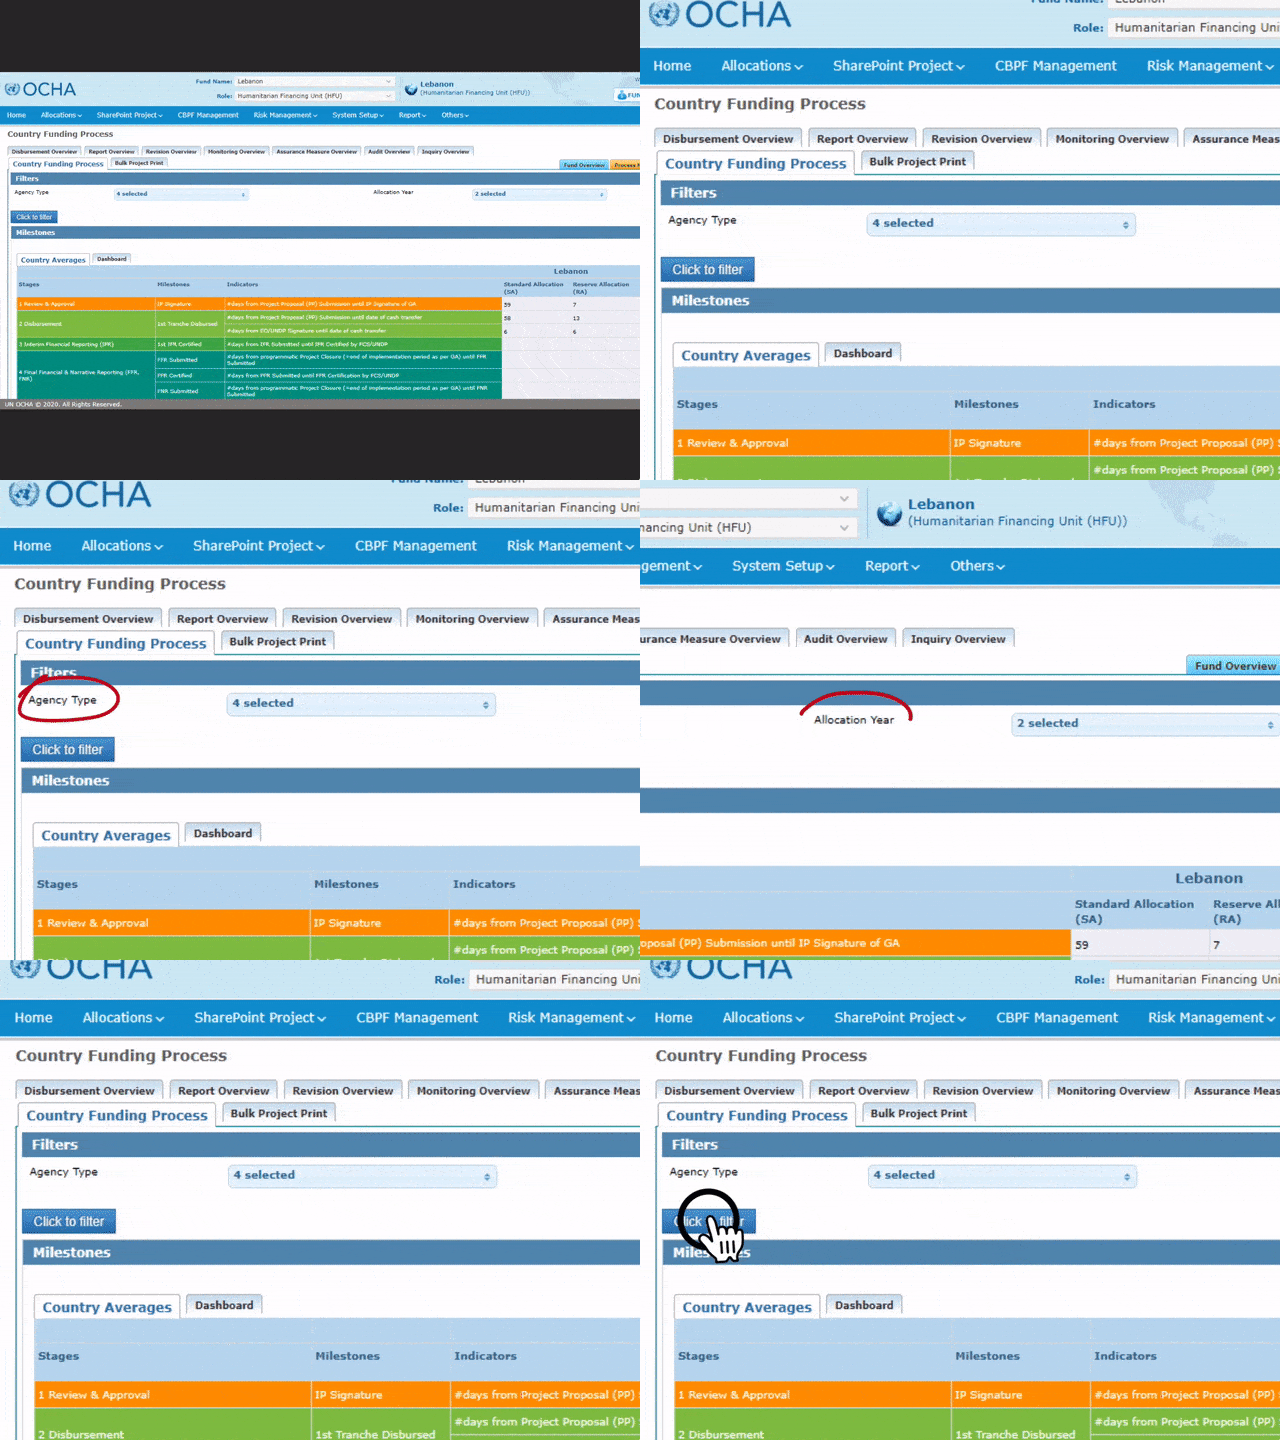
Navigation: Click on the Country Funding Process icon in the Quick Access-Dashboard on the right-hand side of your GMS Home Page OR Go to Report > Report > CBPF Milestone.

The Milestones Module (or Country Funding Process) provides an overview of the different milestones which a project goes through during its lifecycle on GMS. The module highlights the achievements and marks the performance of each Country-Based Pooled Fund (CBPF) by providing a detailed accounting of the funding chronology, including the review of the projects’ stages, funding milestones, specific time-related and performance indicators, and duration averages.
HOW TO USE AND READ THIS TOOL?
These fields allow HFUs to track progress, identify lags, and support efficient review, disbursement, reporting and audit processes.
Filtering data The default view for the Country Averages tab displays figures for the current year, and all Agency Types. However, you can filter the data related to the Agency/Partner’s type and the previous allocations year by ticking the filters’ boxes in the drop-down lists. After selection, click on [Click to filter].

Filters’ Field Description
• Agency type: Users can select a specific agency type using the drop-down list.
• Allocation year: Users can select one or multiple Allocation year using the drop-down list.
What information does the Country Averages table provide?
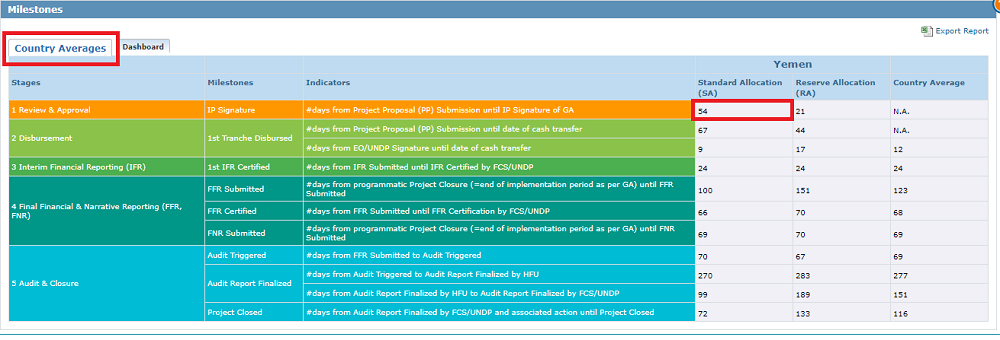
The “Country Averages” tab gives a general overview of all stages, milestones and indicators and provides the average duration between important milestones crossed by a project through its life cycle for a both Standard Allocations (SA) and Reserve Allocations (RA).
For instance, in Yemen in 2019, it took on average 54 days for SA projects to go from Project Proposal Submission to IP signature.

*For this Blog post’s purposes, we used Dummy data. The example above does not reflect the reality.
Filtering data
The default view displays figures for the current year, and all Agency Types, clusters, Standard Allocations and Reserve Allocations (Only applicable if no filters have been selected on the Country Averages tab). However, the filter section of the dashboard tab enables users to select multiple variables that will be applied to the visual appearing below the section.

Filters’ Field Description
• Agency type: Users can select a specific agency type using the drop-down list.
• Allocation year: Users can select one or multiple Allocation year using the drop-down list.
• Allocation type: Users can select one or multiple Allocation type using the drop-down list.
• Cluster: Users can select one or multiple clusters using the drop-down list.
• Agency: Users can single out one or multiple Agencies/Partners by using the drop-down list,
• Allocation Source: Users can select one or multiple allocation source using the drop-down list.
• Project code: Users can single out specific project(s) by entering their project codes in this field. This allows for a complete overview of the project’s milestones chronology!
• Milestones completed: Users can select one specific milestone in the drop-down list. Only the data related to the selected milestone will appear in the visual.
The milestones are the following:
- Project Proposal Submission;
- Strategic Review Completed;
- Implementing Partner Signature;
- Exexcutive Officer Signature;
- 1st Tranche Disbursed;
- Interim Financial Report Submitted;
- Interim Financial Report Certified;
- Final Narrative Report Submitted;
- Final Financial Report Submitted;
- Final Financial Report Certified;
- Audit Triggered;
- Audit Finalized;
- Project Closed
Furthermore, you can select a specific stage of the project workflow by ticking its box in the ‘Stages’ section at the right-hand side of your screen.

The possible stages are:
0: Milestones - when selecting the first stage box, the visual will provide an overview of ALL stages.
1: Review and Approval,
2: Disbursement,
3: Progress Narrative Report,
4: Interim Financial Report,
5: Monitoring,
6: Revision,
7: Final Financial and Narrative Report,
8: Audit and Closure.
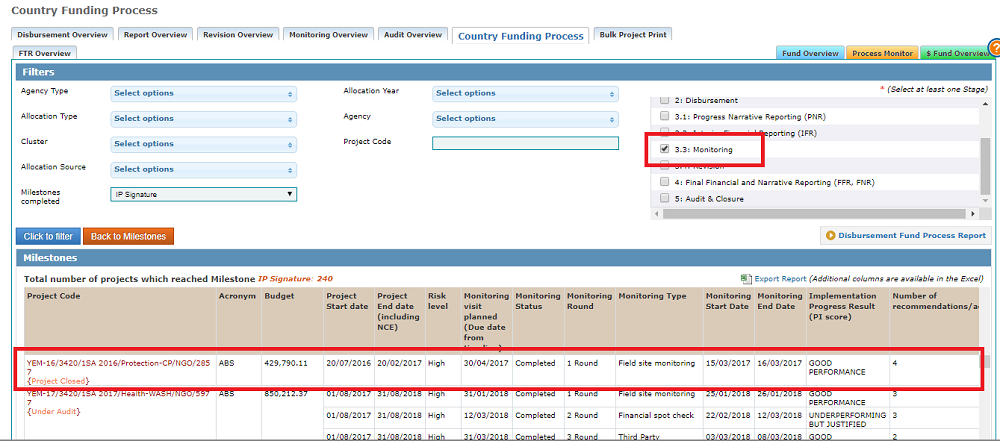
When selecting one or several stage(s), all related milestones will be displayed in the visual. For instance, to see the data related to the monitoring stage, including the related milestones, dates and indicators, select the monitoring stage in the Stage box.
After selection, click on [Click to Filter].

What information does this tab provide?
The Dashboard tab displays all submitted projects on the GMS and their respective Agencies/Partners and provides the dates of each milestones’ completion, as well as the number of days between two milestones, including the milestones’ respective indicator(s).
This visual’s characteristics are provided below for the Milestones (all stages overview), i.e. when users DO NOT select a specific stage:
- Project code
- Project current workflow status
- Implementing Organization’s name
- Stages
- Milestones
- Date of milestone completion (a blank space could mean that the project has not yet reached this milestone. However, it could also mean that the GMS has not yet been updated as per the project’s current status)
- Indicator’s description (hover over the info tooltip
 to access it)
 - Indicator’s value
- Total number of projects which reached the Milestone.
If you previously selected stage filters, for instance, if you selected the ‘3.3: monitoring’ stage in the Stage filter Box, all projects’ monitoring milestones and data will appear.

Disbursement Fund Process Report
The Disbursement Fund Process Report page provides an overview of the different disbursement milestones, including dates and length averages. It is accessible from the dashboard tab of the Country Funding Overview page.
To access the Disbursement Process Report page, click on [Disbursement Fund Process Report].
On the Disbursement Fund Process Report, select your variables using the filter options at the top, and click on [filter] to access all available information on the disbursement of funding per project, including:
- The project’s budget;
- The EO’s signature of the GA date;
- The first disbursement date;
- The first financial Report certification date;
- The second disbursement date;
- The second Financial report certification date;
- The third disbursement date
Similar to the milestones’ modules, time indicators are also shown in this table.

GMS TIP: EXTRACT RAW DATA (Excel format)
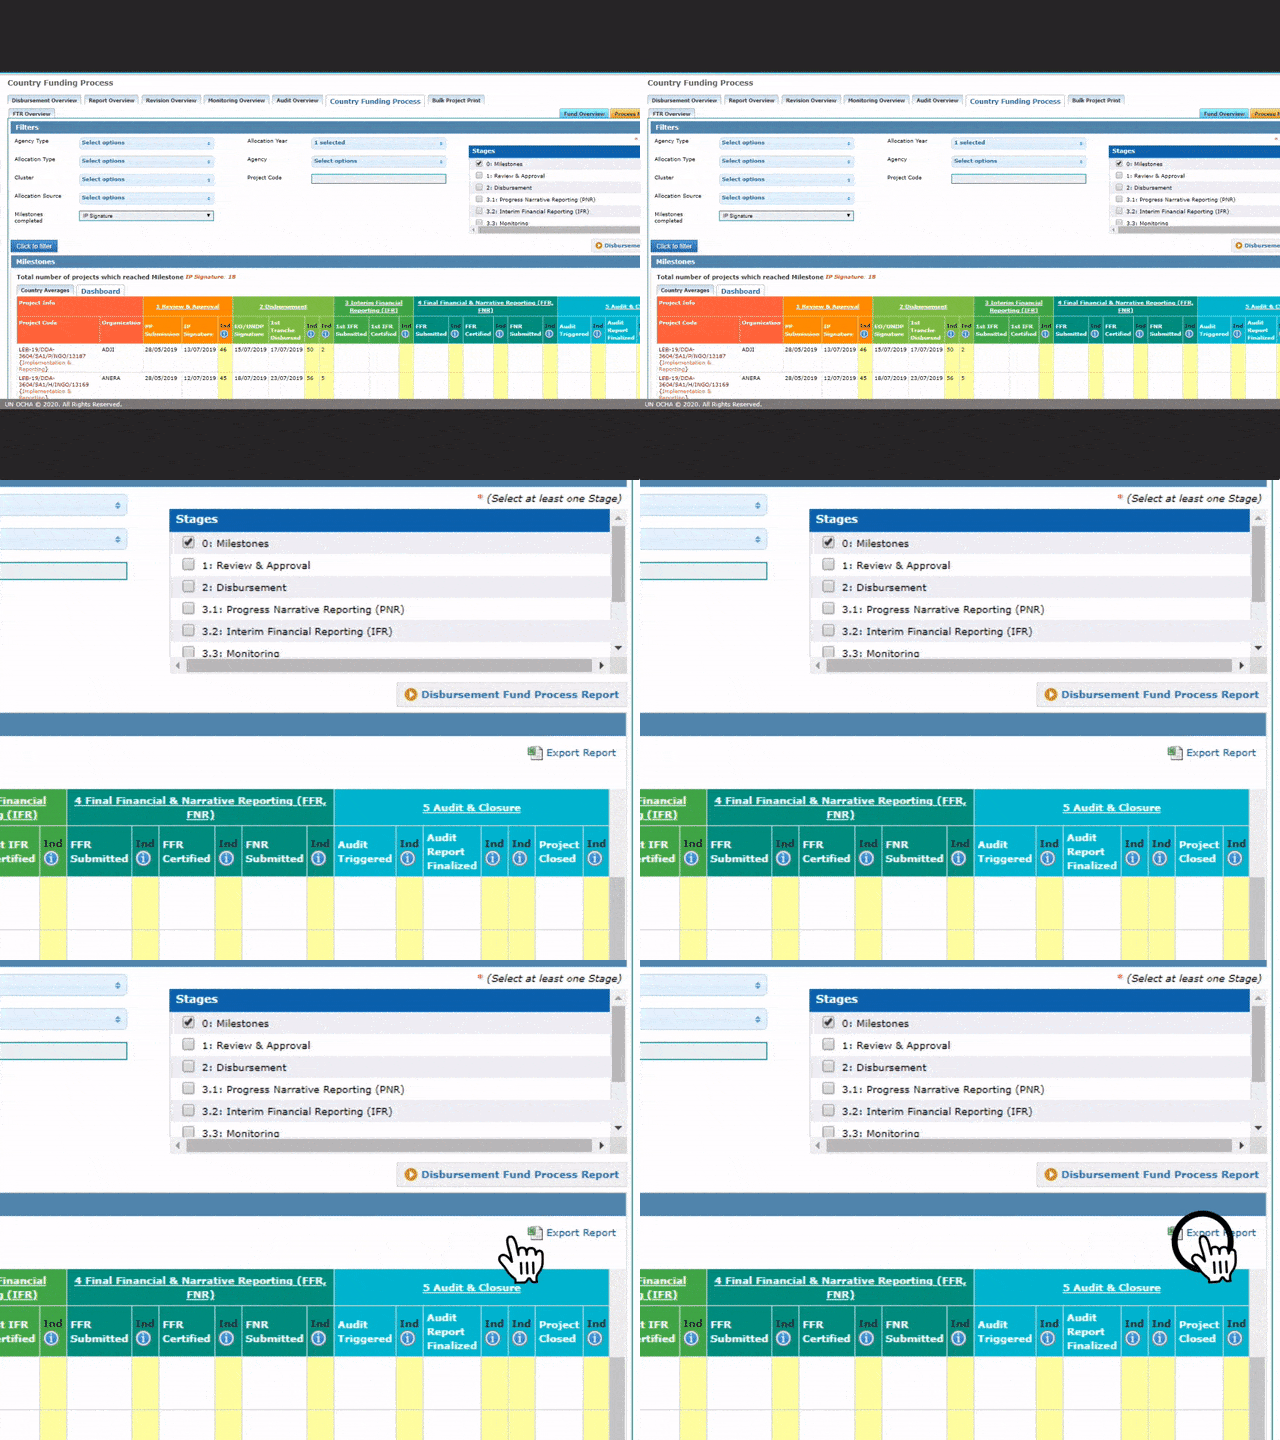
You can extract the raw data of all the aforementioned modules by clicking on the [Export Report] button located in the top right corner of the module’s visual.
We recommend to extract the data as an Excel sheet, especially if you applied filters, as the extracted excel document includes more information than what is provided in the visual on the GMS.

You can find more information on the GMS milestone module on the GMS Help Portal by clicking HERE.
