I) How to apply filters to the map
II) How to access and extract the map’s data
III) How to clear the applied filters and reset the map
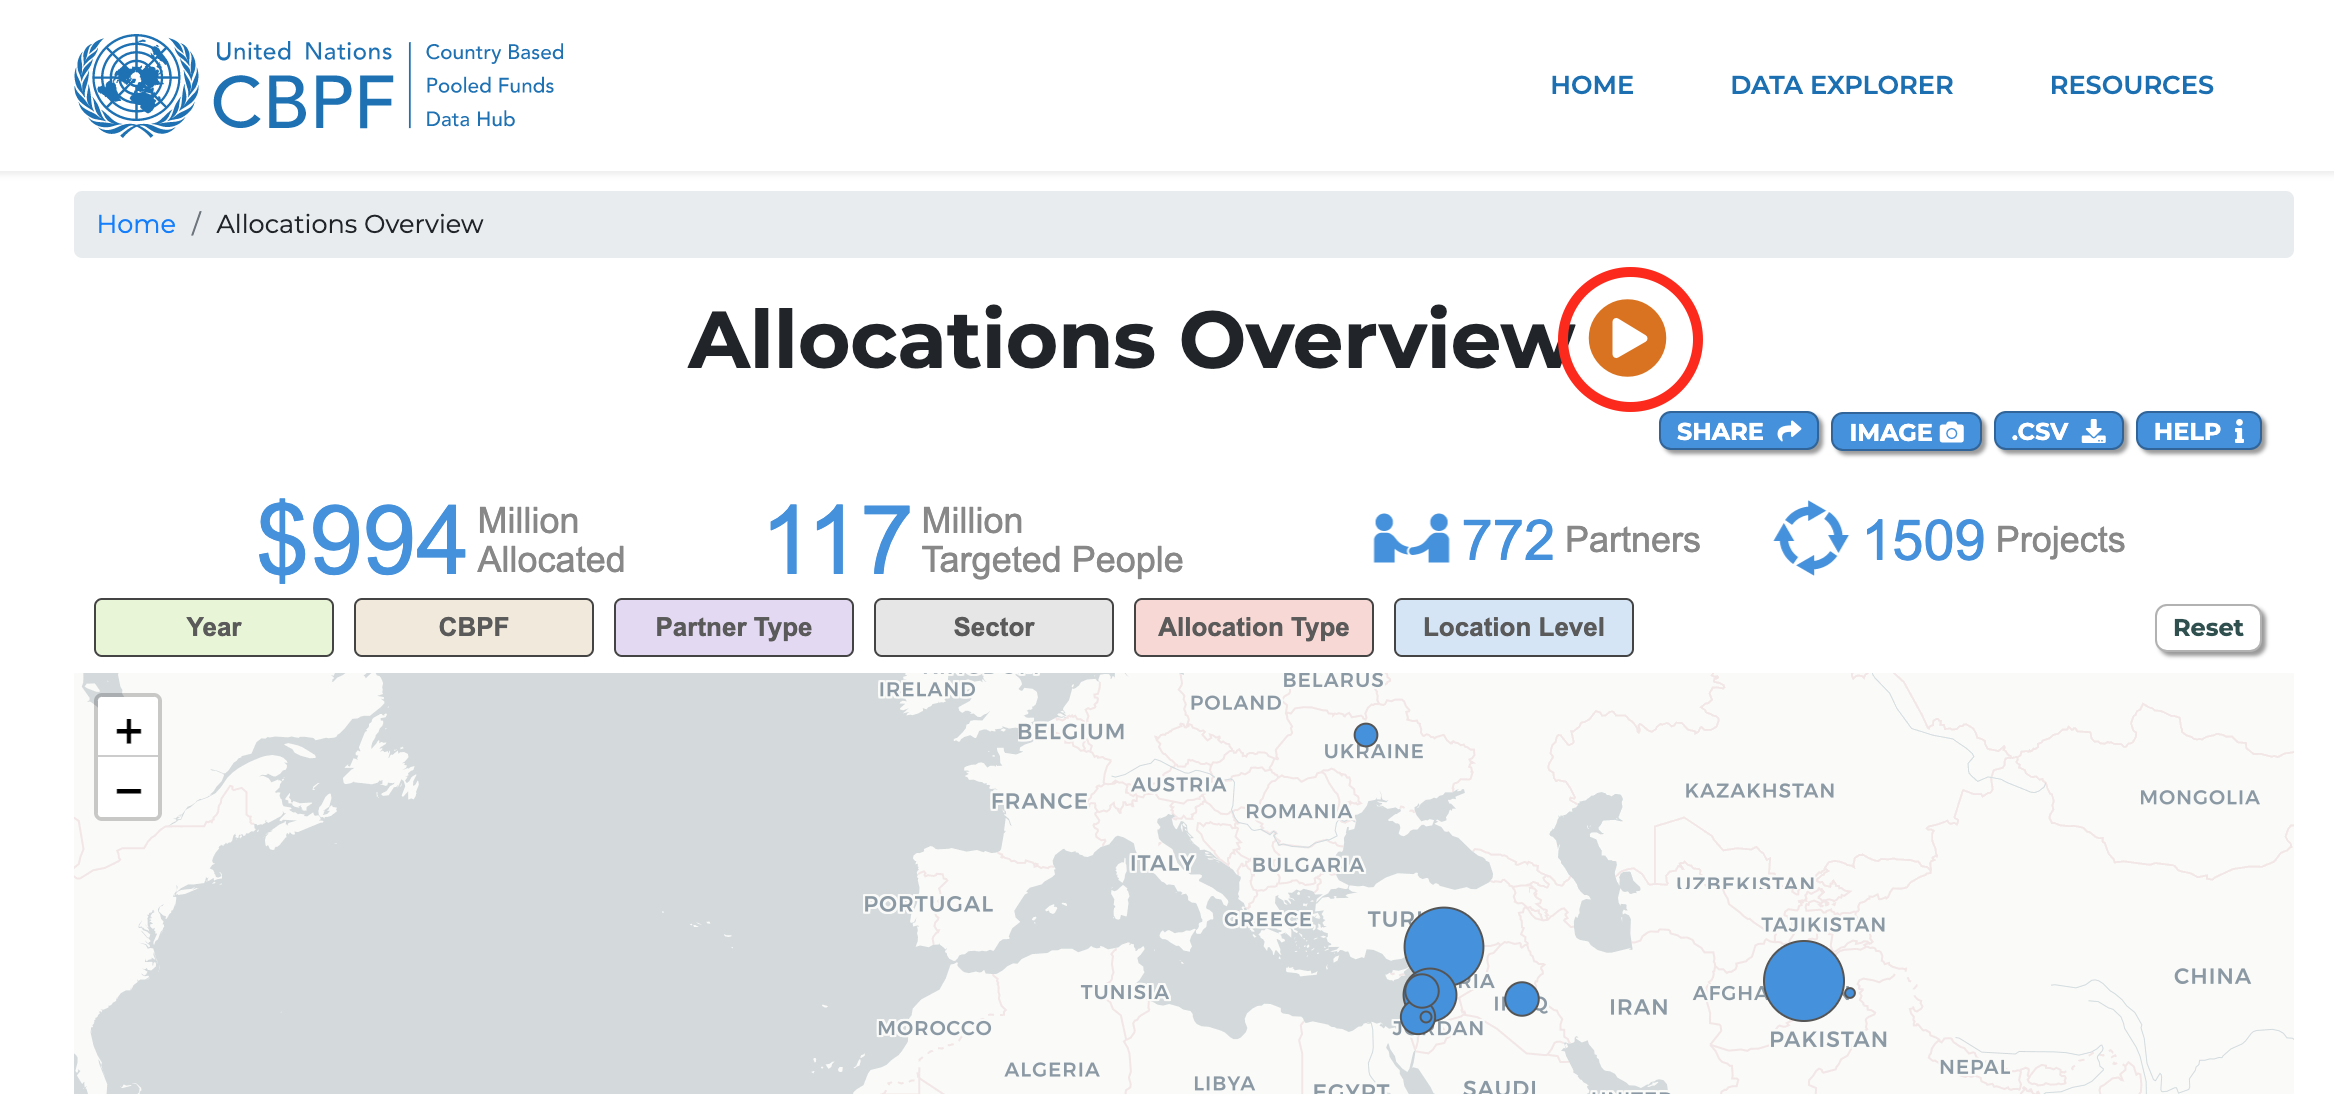
The Allocation Overview visualization is an interactive map that gives users an overview of allocations and projects implemented in terms of locations across OCHA’s CBPFs.
I) How to apply filters to the map
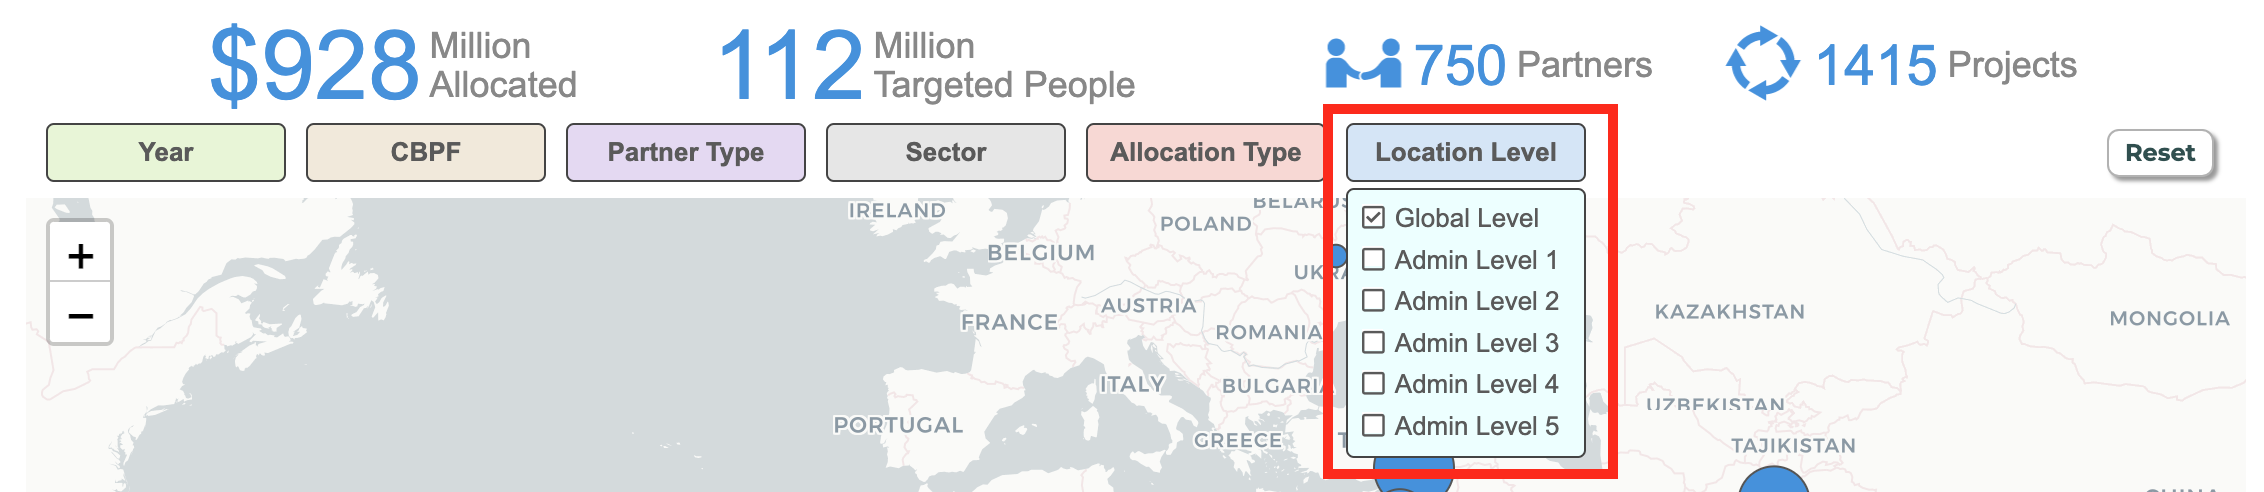
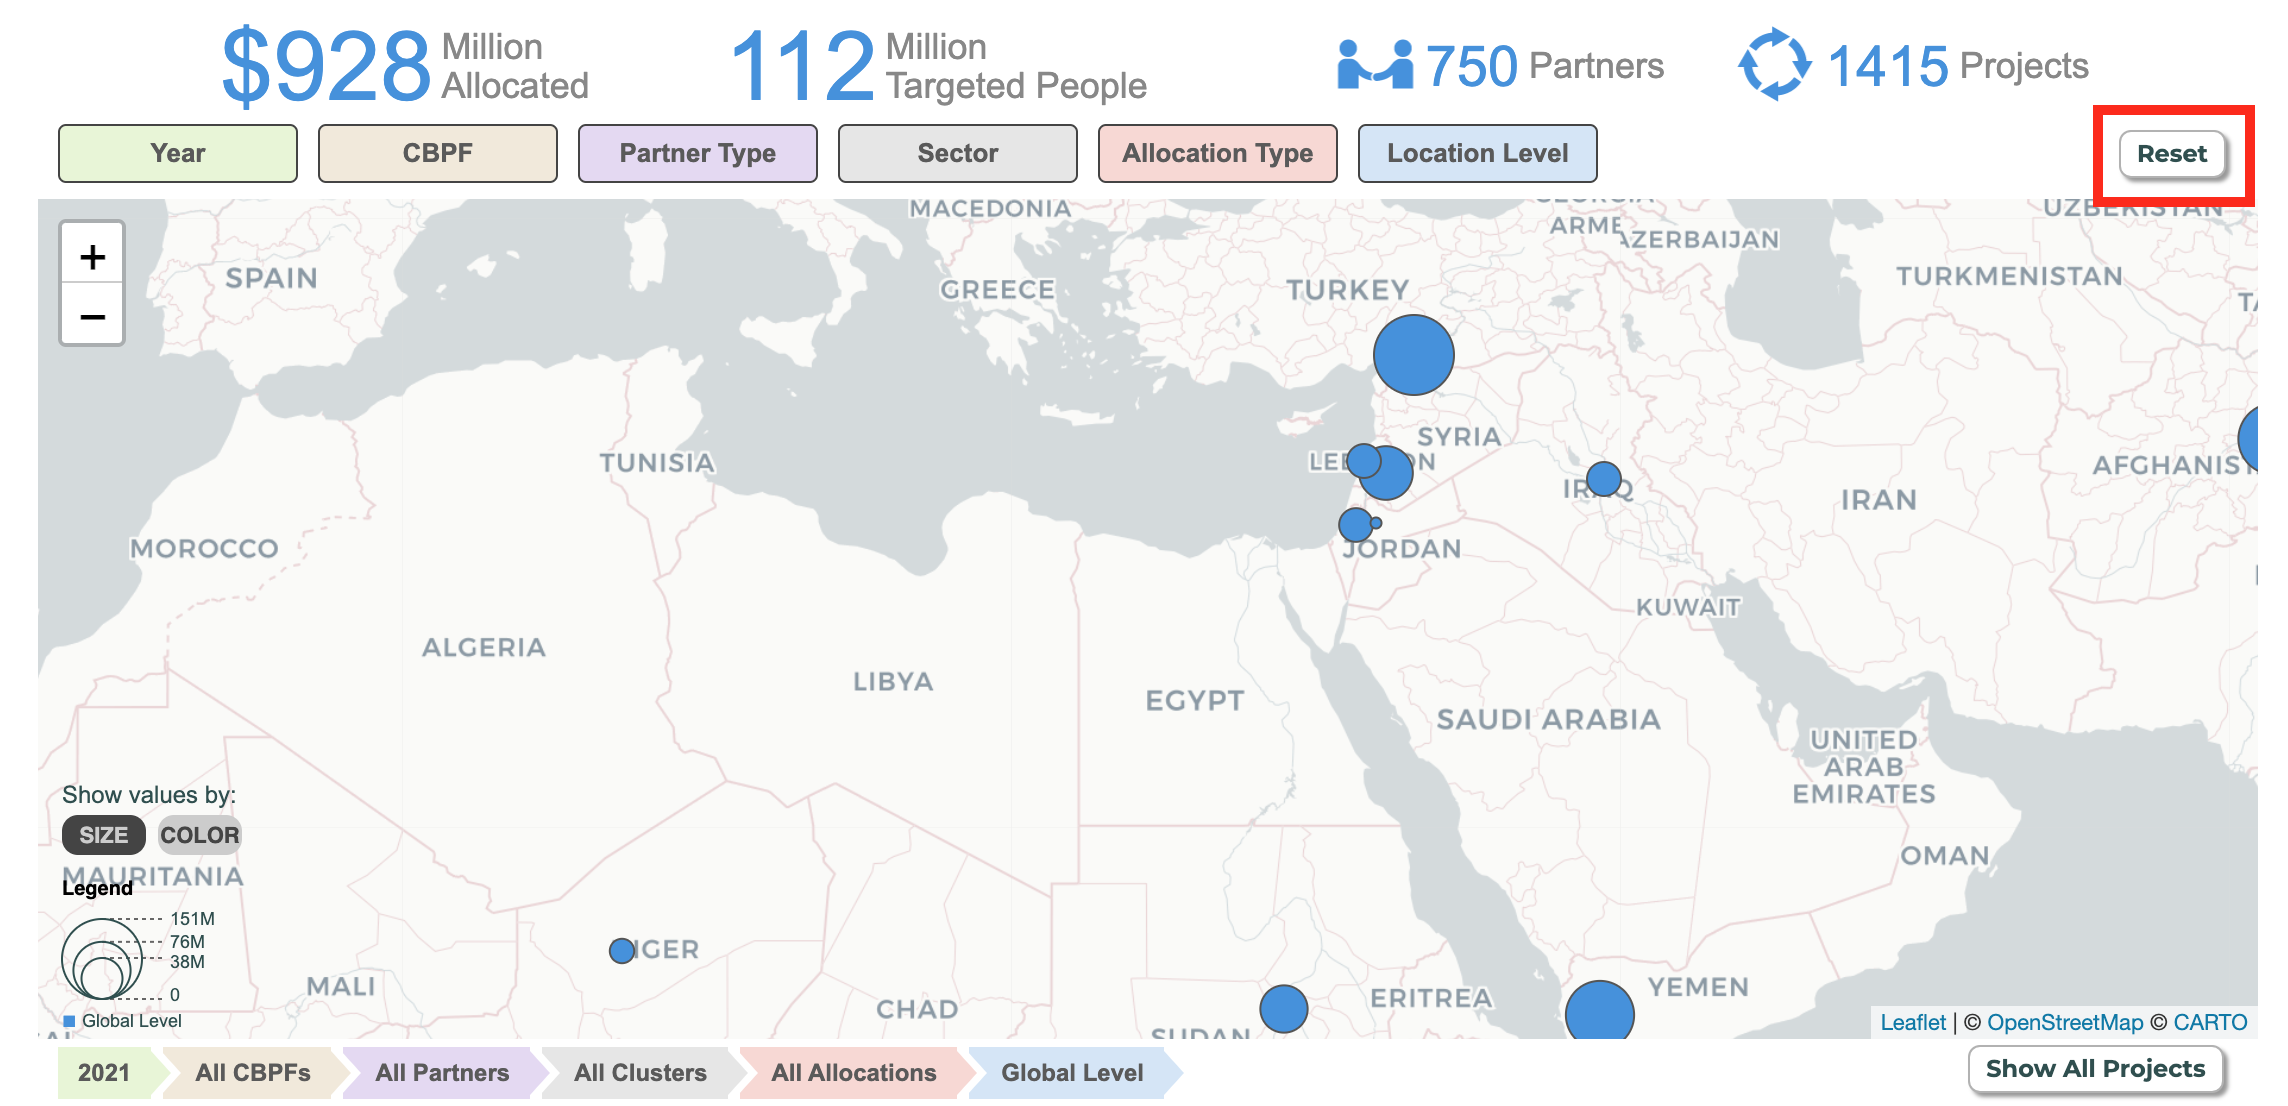
Users can personalize the map by applying the following filters located at the top. These filters allow for a tailored extraction of projects in a specific area or across several locations.
- Year
- CBPF
- Partner type (International NGO, National NGO, Others, UN Agency)
- Sector
- Allocation type
- Location Level (the administrative and structural level of governance)
The filters are interdependent: as you select a year/CBPF/partner type, the other filters will be adjusted accordingly.
Simply hover over the filter you wish to apply and select one or multiple variable(s) in the drop-down list (see screenshot below with example for 'Allocation Type' filter drop-down list).
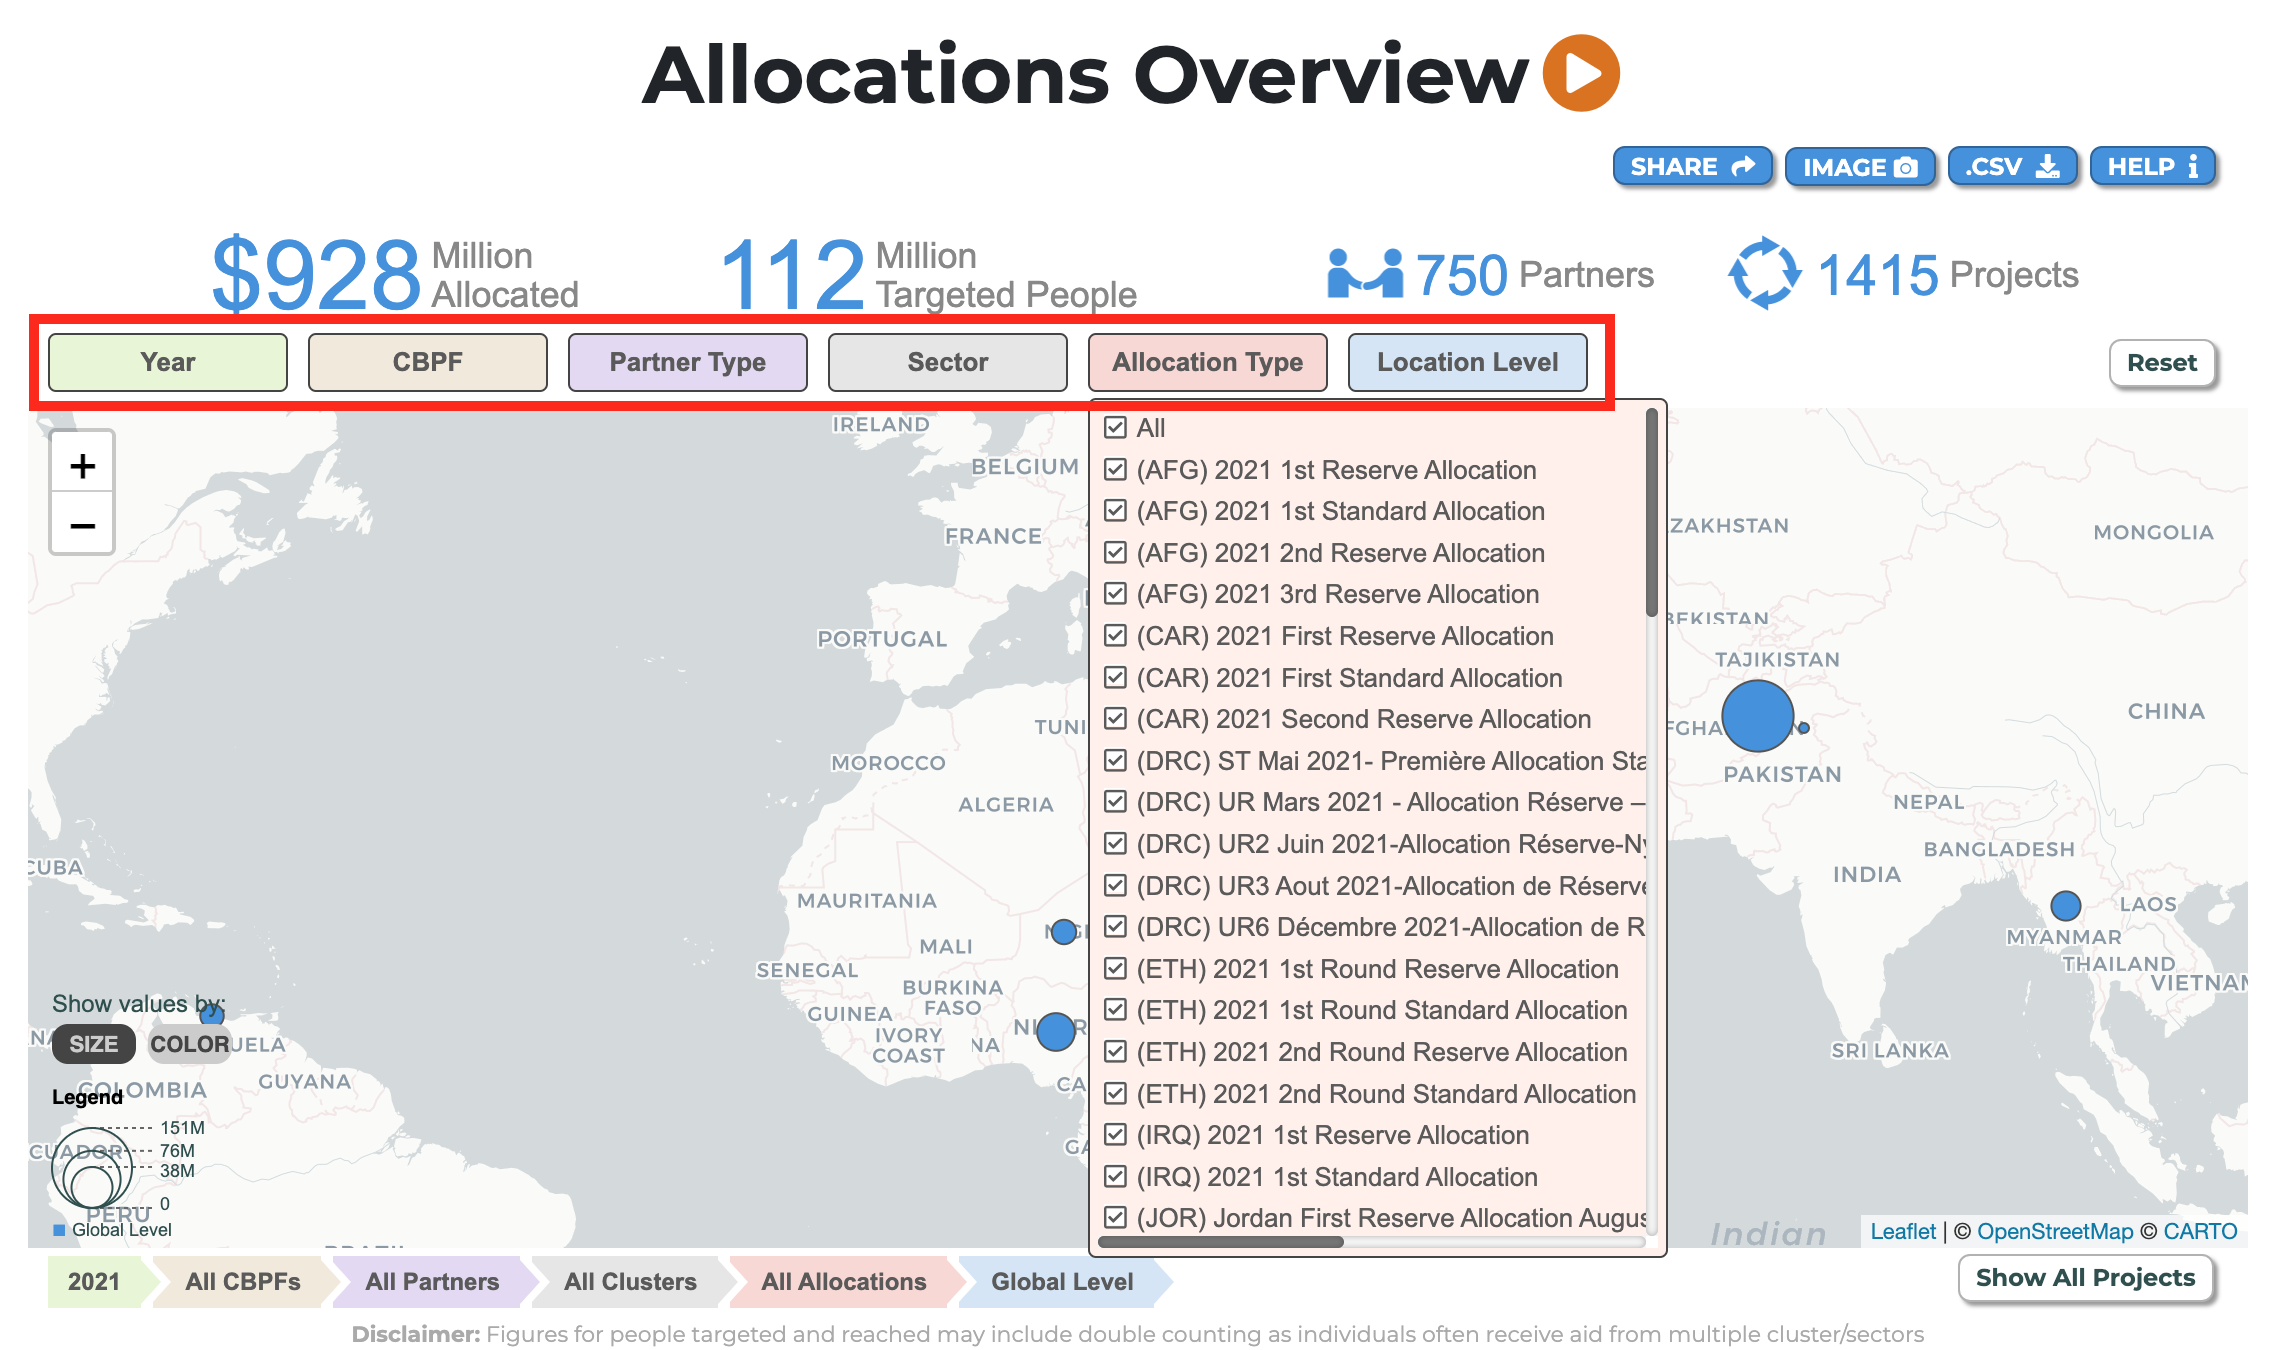
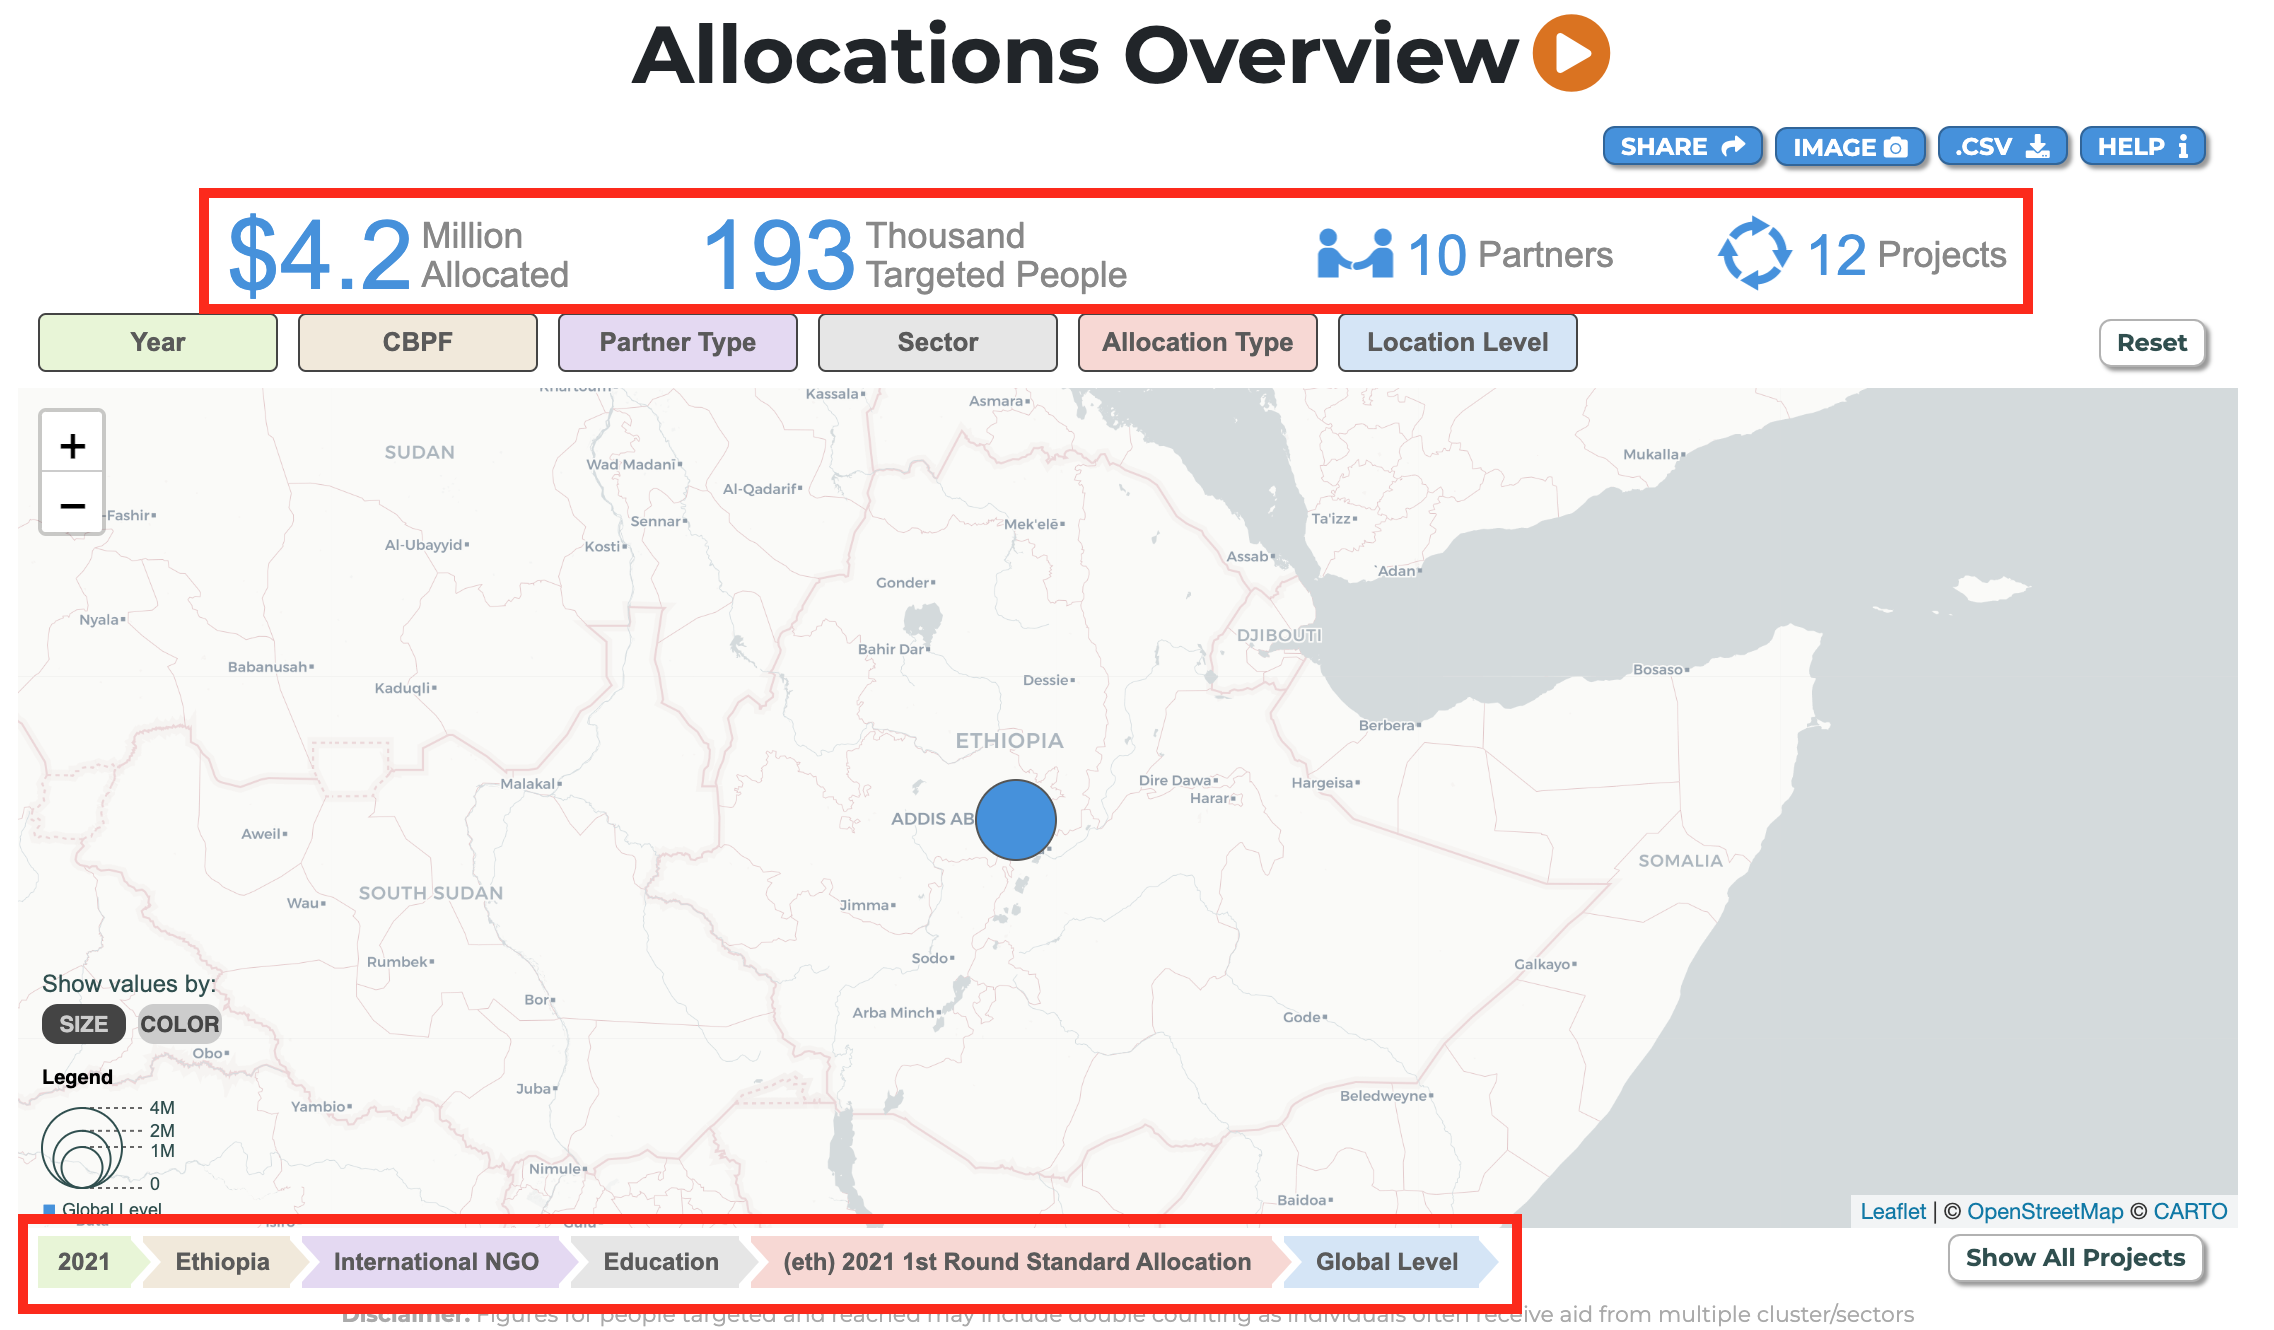
Your filters' selection also applies to the allocation key figures in blue above the map and is indicated by the sequence below the map.
II) How to access and extract the map’s data
The map provides information at two levels:
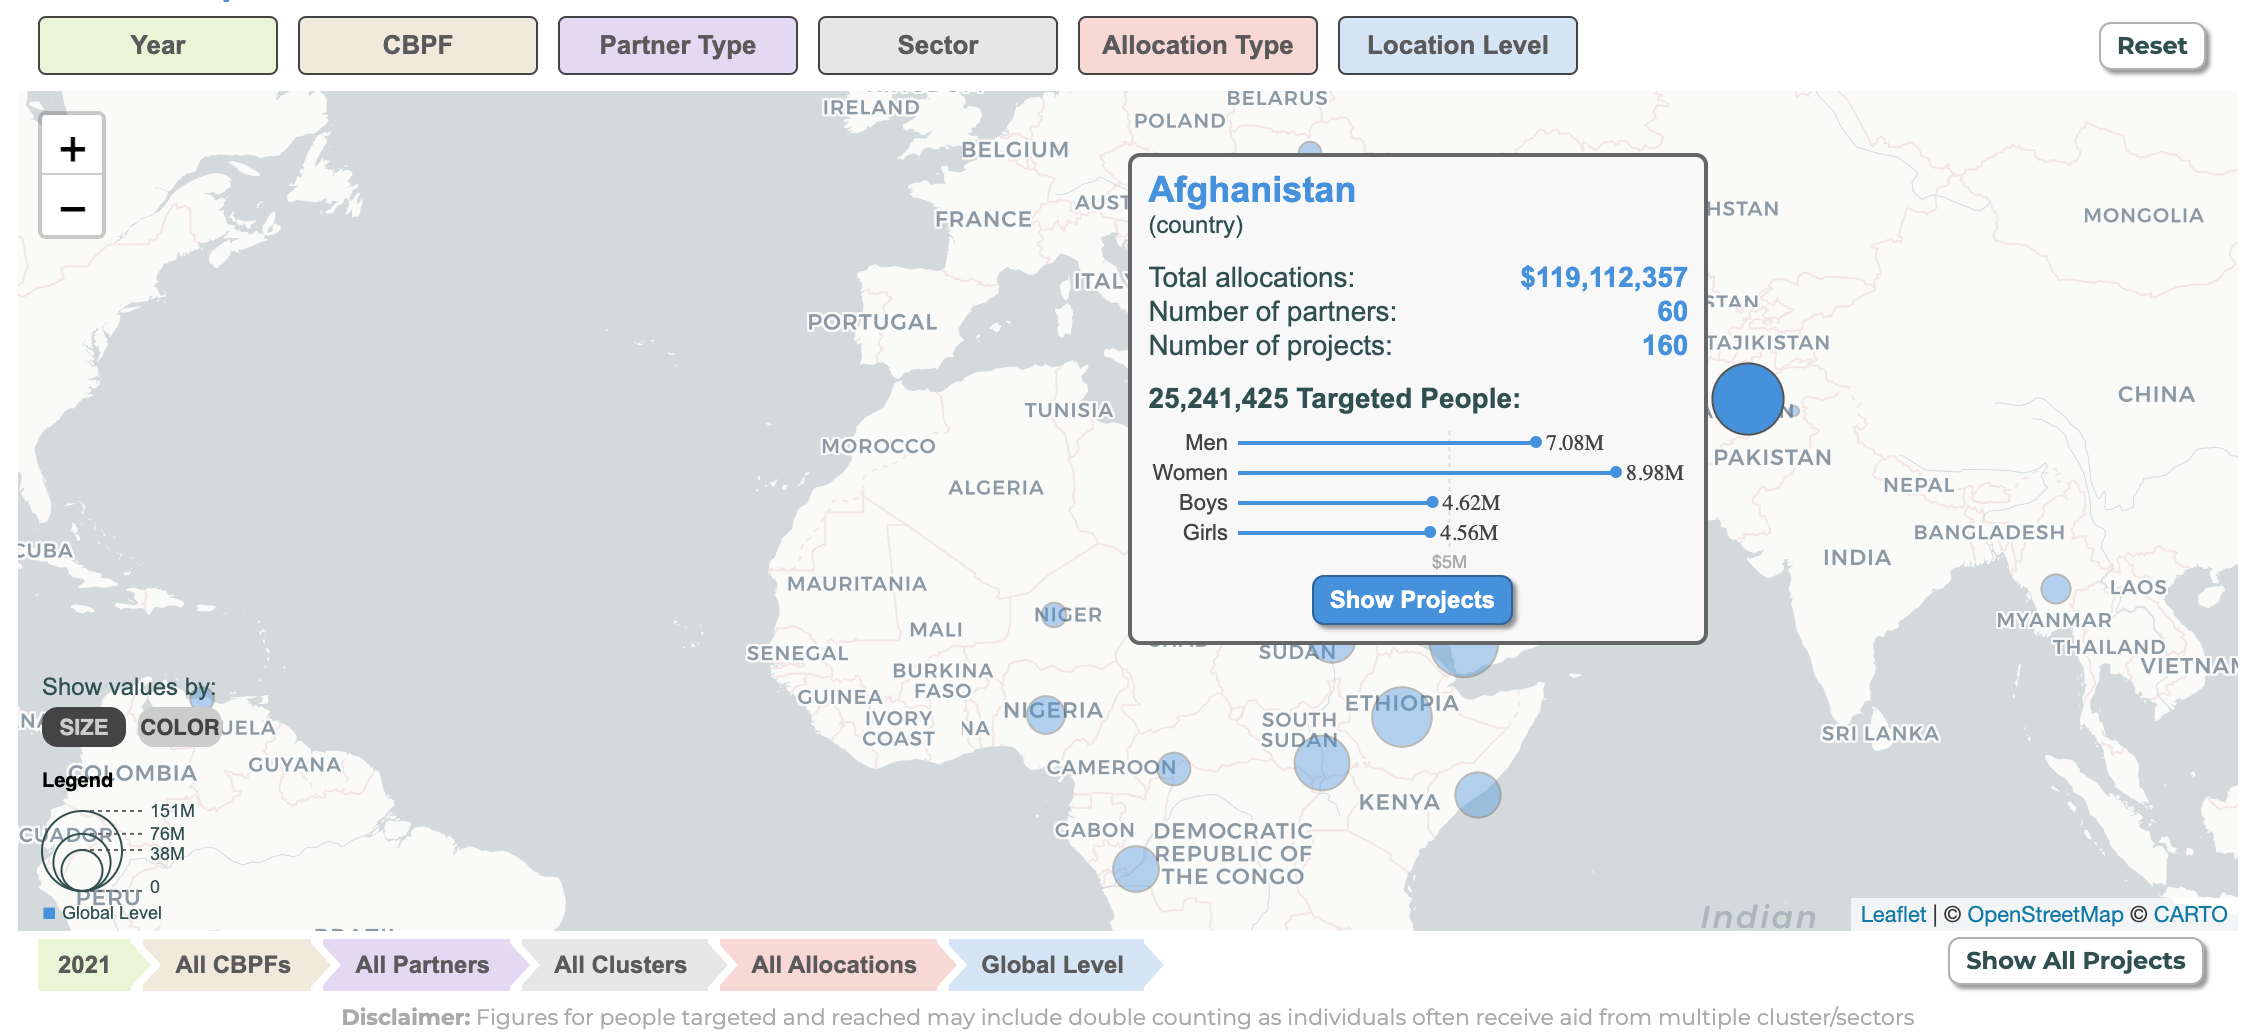
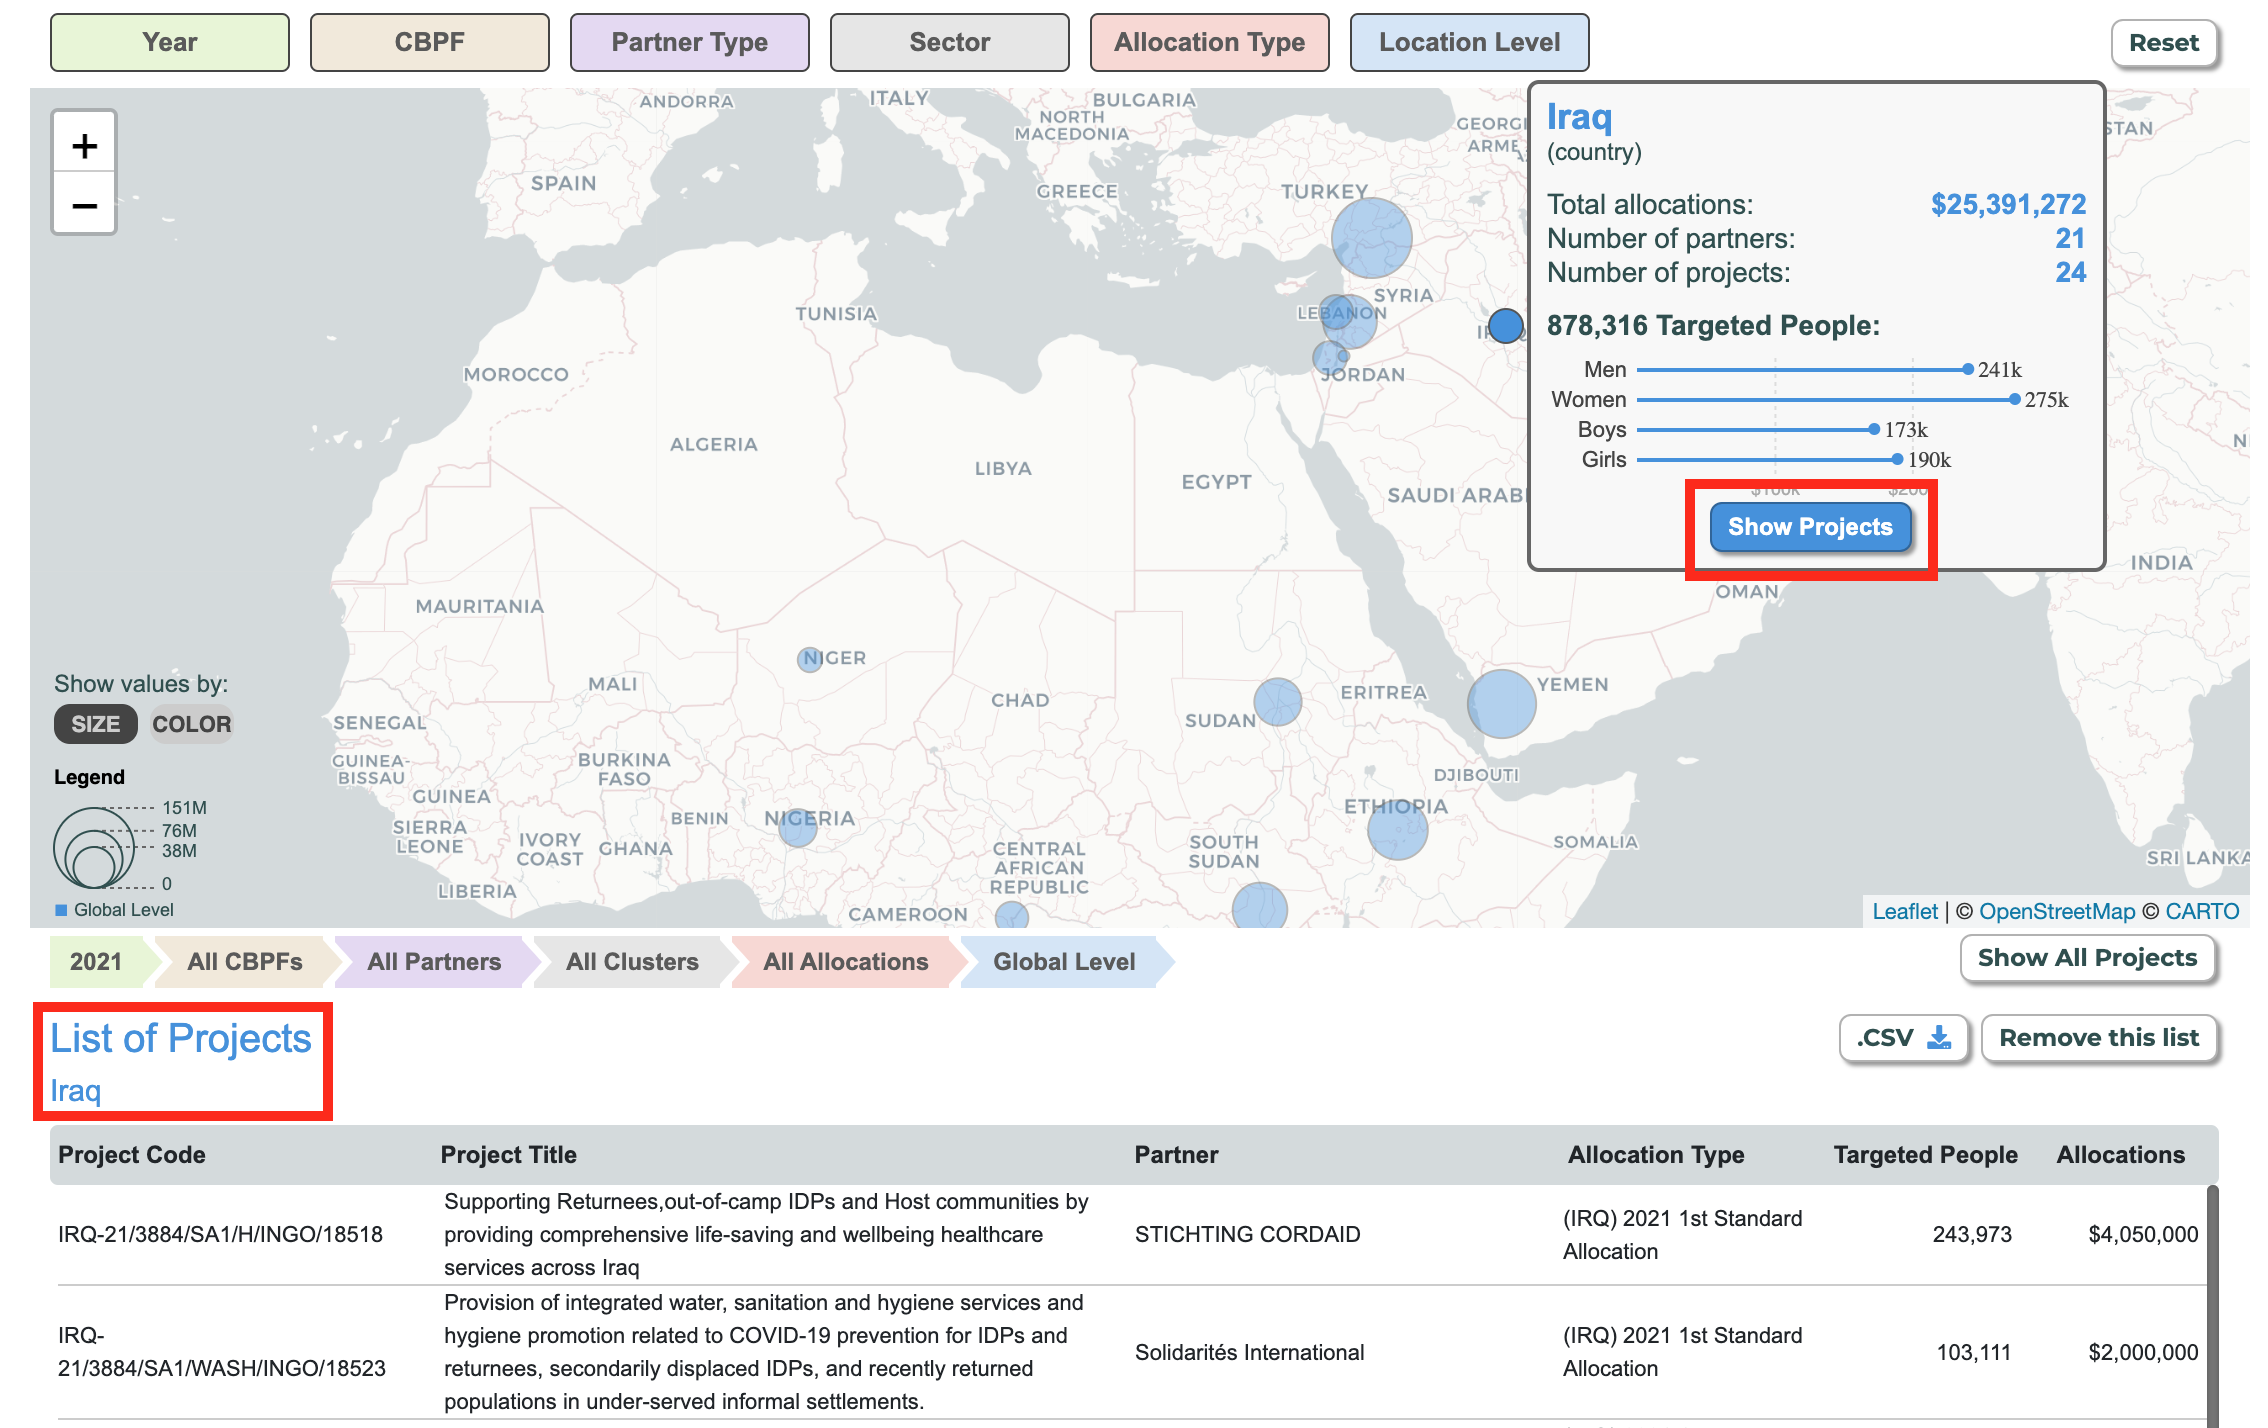
- The brief overview per location, which shows on the map the following information per fund/selected location:
- The total allocated budget.
- The number of partners.
- The number of projects.
- A breakdown of targeted and reached people per gender and age.
Hover over the Fund's/location's marker to see its tooltip.
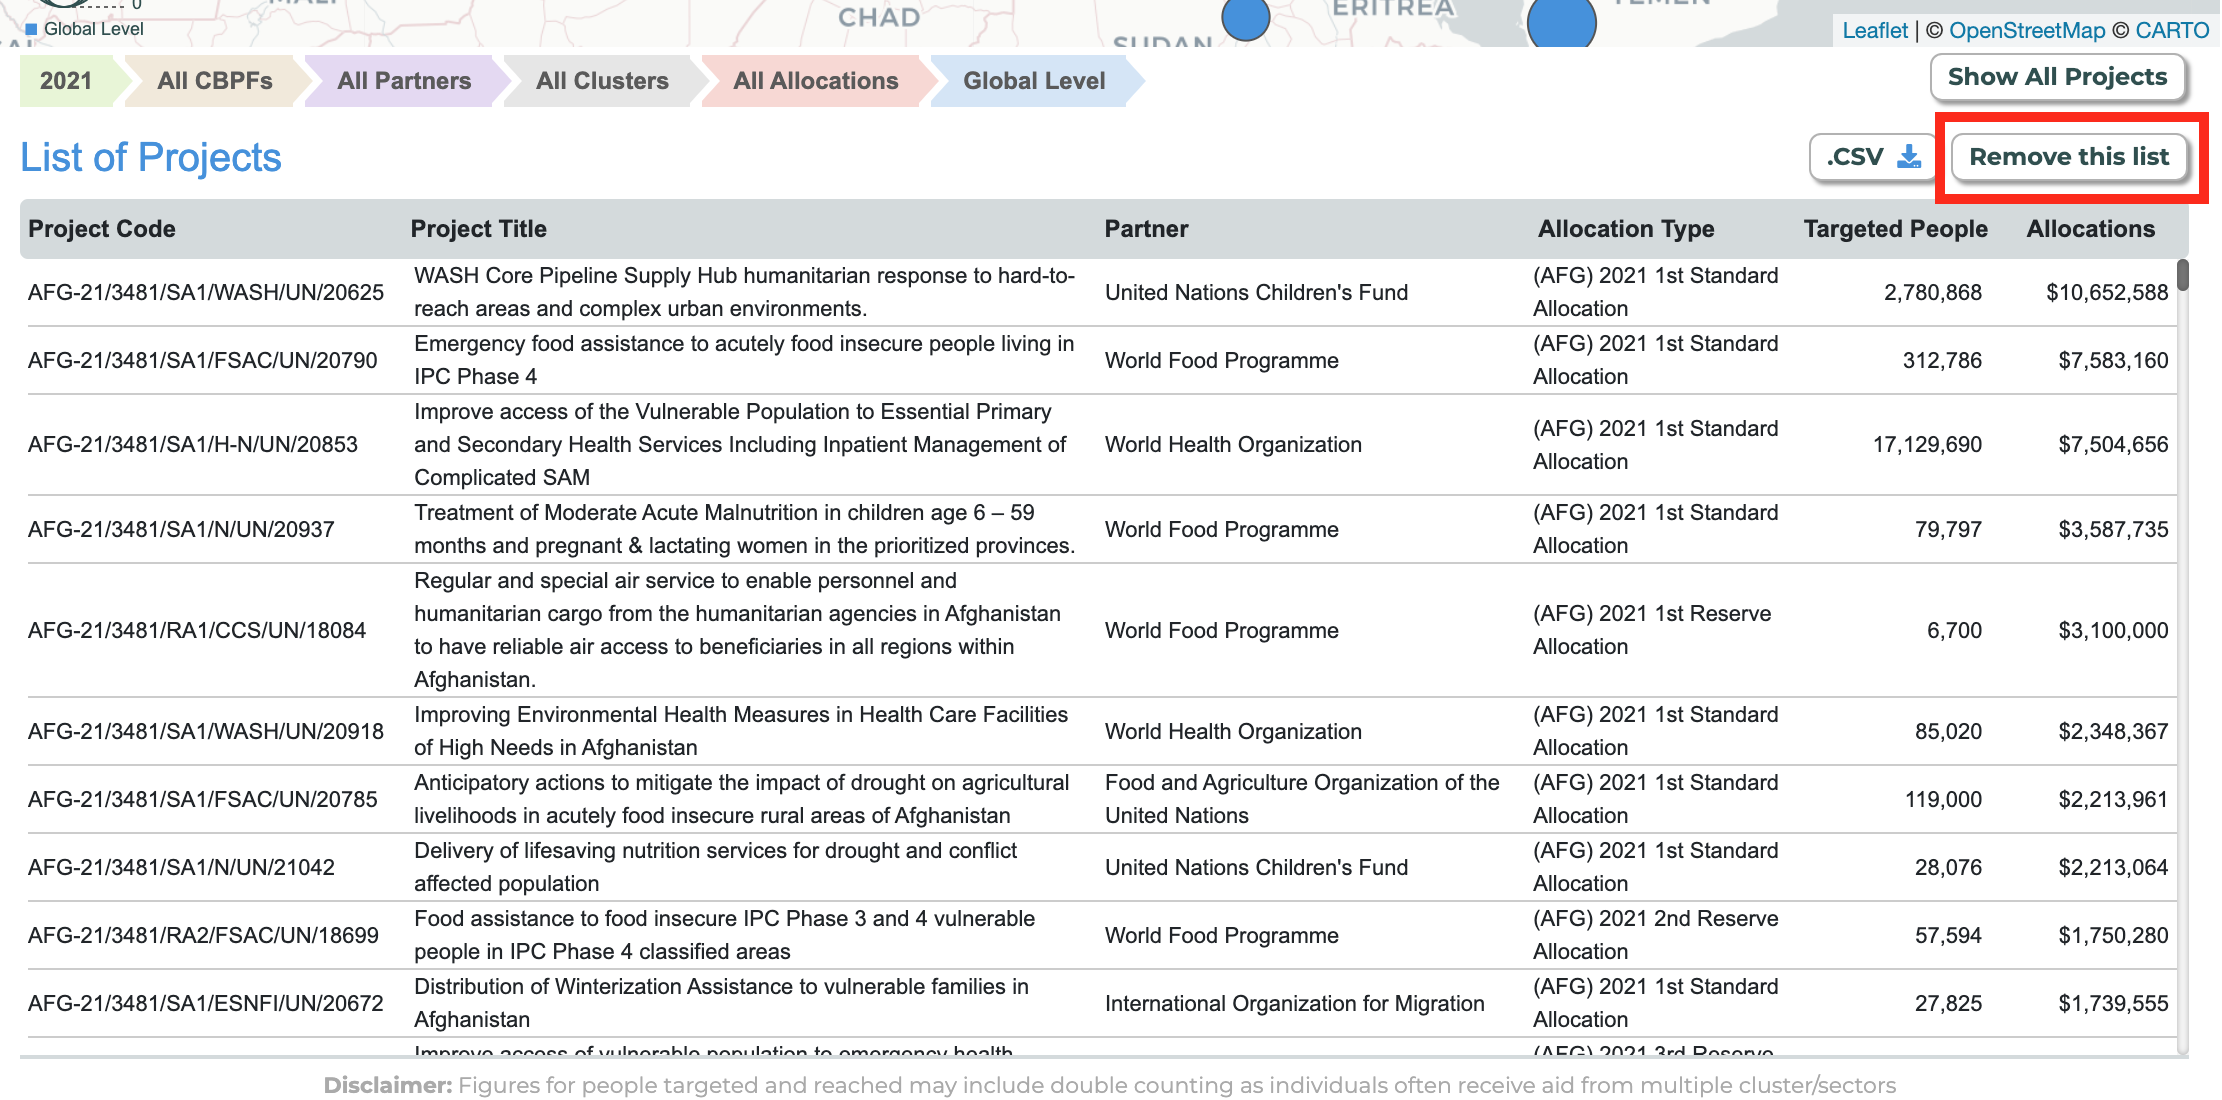
2. A more detailed overview, which gives, below the map, a full list of projects implemented (either globally or in a specific Fund).
This list includes the main projects' characteristics:
- The project's code.
- The project title.
- The Implementing Partner's name.
- The allocation type.
- The project’s number of targeted people in the selected CBPF/location.
- The allocated budget for the project in the selected CBPF/location.
To access the list of specific projects filtered in a CBPF/location on the map, hover over the region you are interested in, and click on [Show Projects].
This overview can also be accessed by clicking on [Show All Projects] to generate the list of all projects globally.
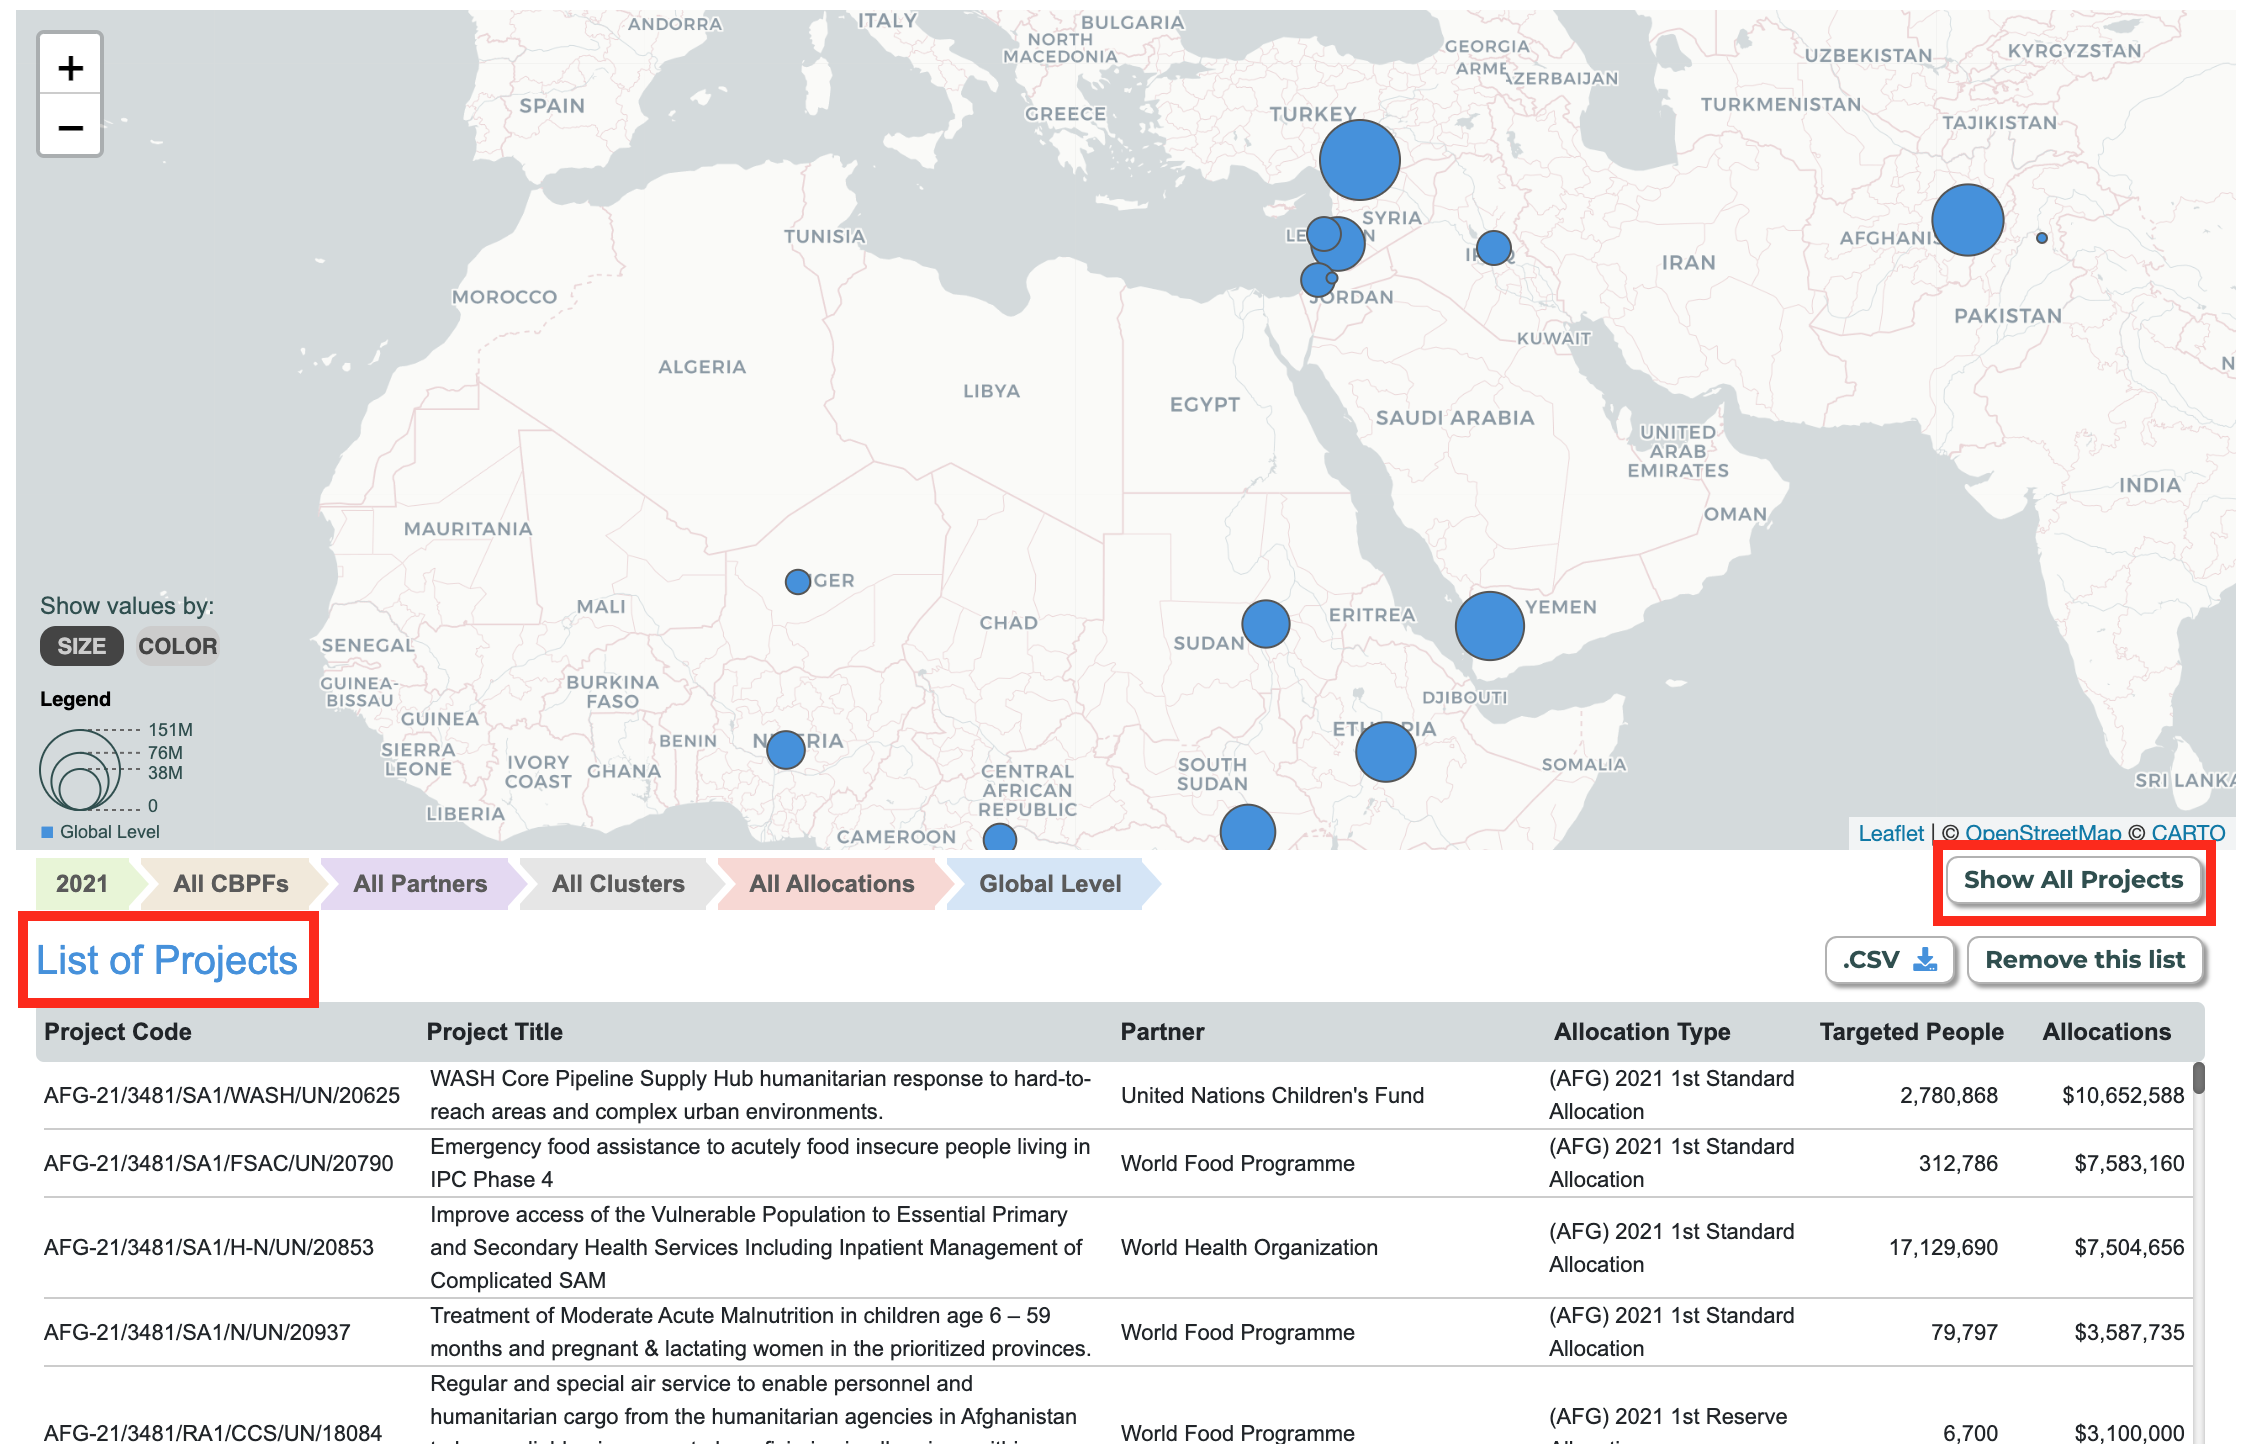
Please note: this list is generated at global level. Hence, the [Show All Projects] button will only be visible if you selected [Global level] in the 'Location level' filter options.
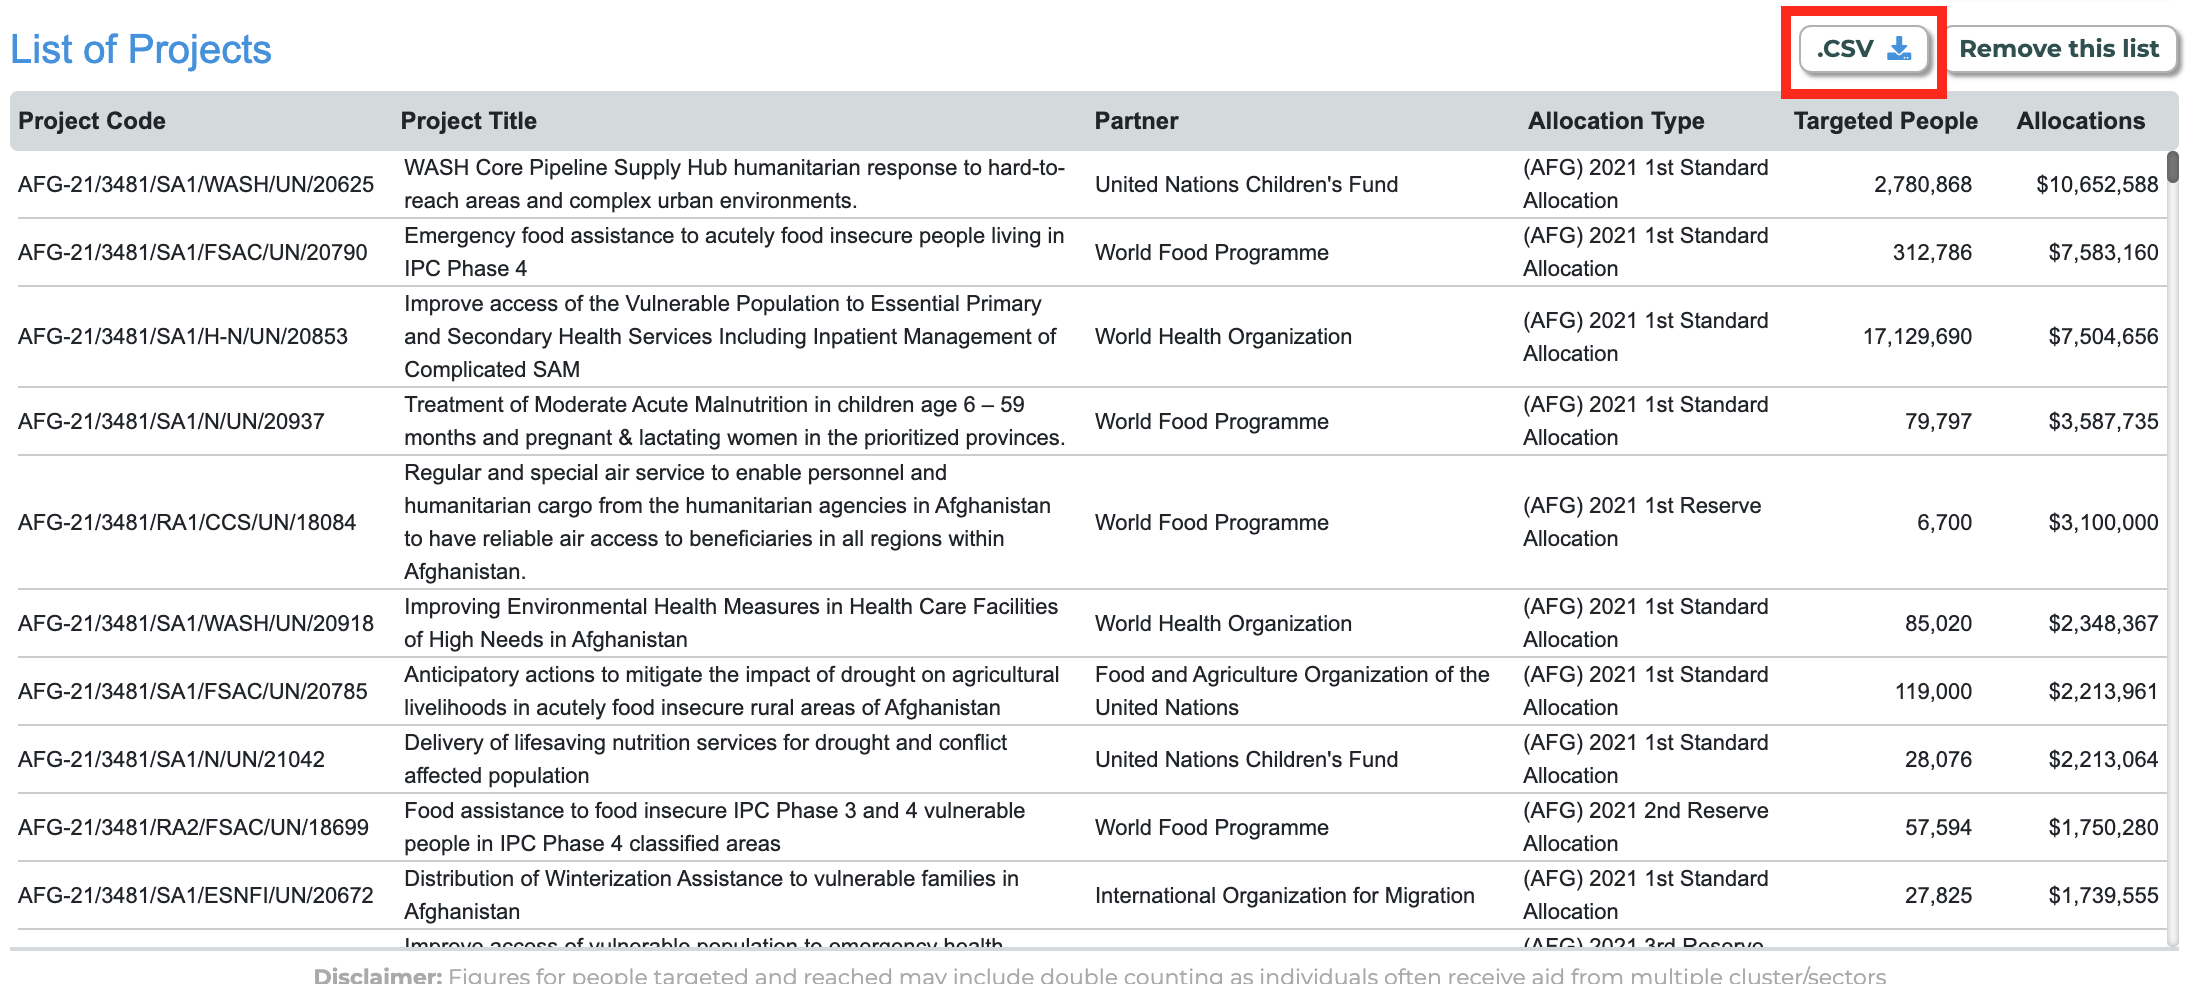
The list of projects can be downloaded as an excel sheet by clicking on [.CSV].
III) How to clear the applied filters and reset the map
To clear the list, click on [Remove this list].
To reset the whole map and clear all filters applied, click on [Reset].
Please note: for more information on this visualization, you can refer to the tutorial video by clicking on this icon ![]()