- What is the OCHA Assurance Dashboard and how to access it?
- How to apply filters to the OCHA Assurance Report?

- How to read and interpret the data?
- How to extract the data as an Excel sheet
I) What is the OCHA Assurance Dashboard and how to access it? Top
Purpose: The OCHA Assurance dashboard allows authorized users to generate an OCHA Assurance Actions report, which provides a consolidated data output from pooled funds based on the different filters applied on GMS.
Navigation: Report > Report > OCHA Assurance
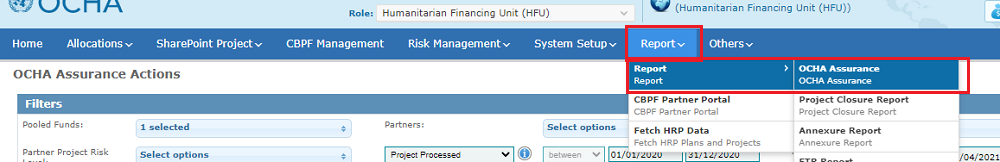
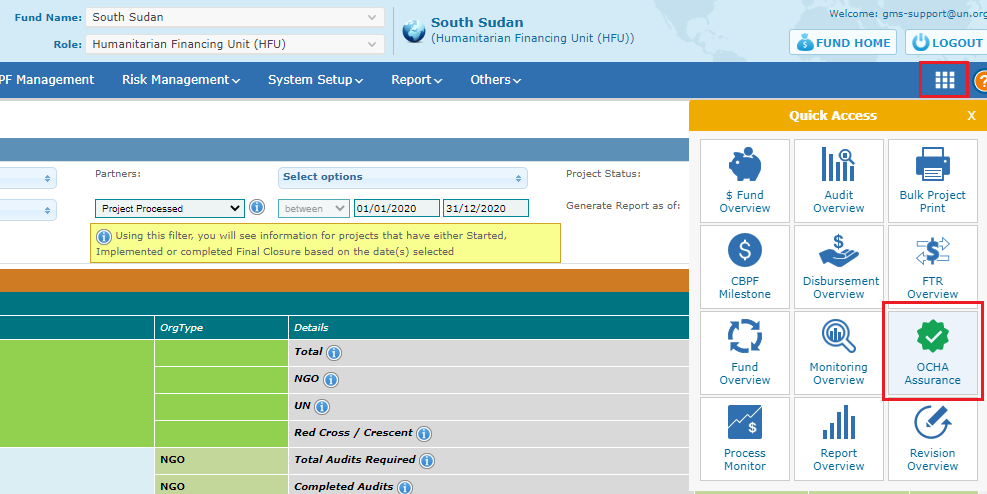
You can also access the OCHA Assurance report through the Quick Access .
.
II) How to apply filters to the OCHA Assurance report Top
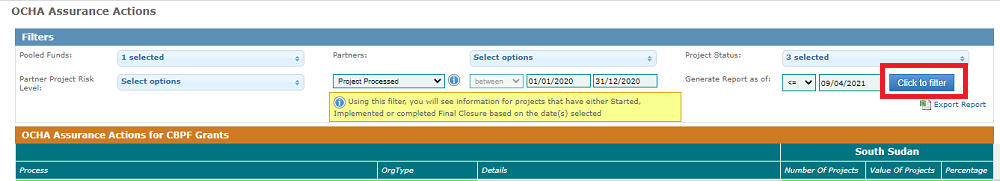
In order to find the most relevant information to their search, users can apply filters to the OCHA Assurance report. You can find below a description on each of the filters available in this module.

Filters Field Descriptions:
• Pooled Funds (drop down menu): Lists all the available pooled funds. By default, the fund name which the user is currently accessing in GMS will be taken as the selected pooled fund.
• Partners (drop down menu): List of all the partners enrolled in the Pooled funds selected.
• Project Status (drop down menu): Lists the project statuses (Under Approval, Under Implementations, Under closure, and Closed). By default, it will select the last three Project Statuses.
• Partner Project Risk Level (drop down menu): List of all the Risks available (Low, Medium, High and Ineligible).
• Project Processed (drop down menu): Lists all the filters available for the date of projects (by default, the Project Processed will be selected):
- Project Processed: Includes projects started, completed (reached project closure), ongoing or both started and completed during the given dates.
- Allocation Year: Displays information on projects for the selected Allocation Year(s) (Note: project from one allocation year with actual start date or approval date from the next calendar year would be included here).
- Disbursement Date: Displays data for projects, which disbursement has been processed during the given dates.
- Implementation Start Date: Enables to filter projects based on project implementation date (i.e. Actual Start Date of the project).
- Project Approval Date: Enables to filter projects based on project the project approval date (i.e. EO signature Date of the projects).
- Project Closed Date: Enables to filter projects based on the project closure date.
*Please Note, you can find a brief description of this filter when hovering over the information icon .
.

• Generate report as of (drop down menu & date box): Select the option (<= 'Less than or equal to', >= 'Greater than or equal to') and enter the date frame for which you would like to retrieve the data.
Note: The data will be filtered with respect to all the options selected in the filters, as per given date provided in 'Generate report as of'.
After applying filters, click on [Click to filter] to generate the OCHA Assurance Actions report.
III) How to read and interpret the data Top
OCHA ASSURANCE MAIN INFORMATION AND FEATURES
The OCHA Assurance table is composed of 6 columns, providing information on the five project’s processes. Described below are the information and features provided in the different columns.
To learn more about each process, we provide HERE an in-depth description of all information provided per process.
Columns Descriptions:
• Process: Displays the 8 processes used for OCHA Assurance (which are as follows: Grant – Audit - Interim Financial Report - Final Financial Report - Progress Narrative Report - Final Narrative Report - Monitoring - Financial Sport Check).
• OrgType: Displays for which organization type the 'Process' information is shown (UN, NGO, Red Cross/Crescent).
• Details: Displays detailed description for each of the 'OrgType/Process' breakdowns,
• Number of Projects: Displays the total count of projects based on the filters selected and included in the fields Process/OrgType/Details.
• Value of Projects: Displays Budgetary values for the total 'Number of Projects' shown in previous column. Budgetary values have been converted to show amount in $ millions for easier reference.
• Percentage: Percentage value is calculated based on the value displayed in 'Number of projects'. Considering the first row in each instance as the target 100%.
Additional Features:
• Hover over the information icon for a more detailed definition of the process displayed in each line.
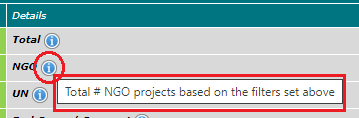
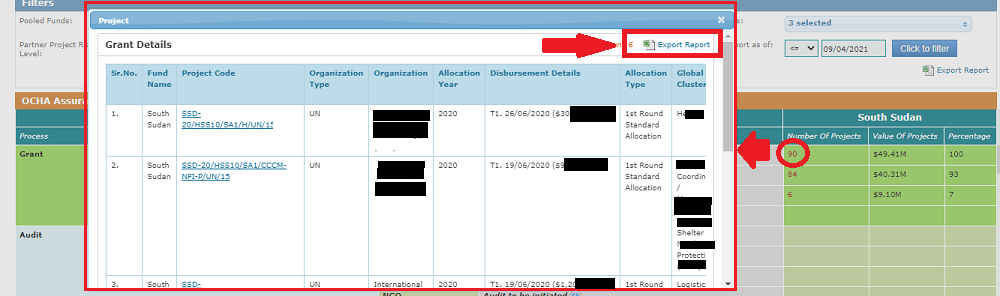
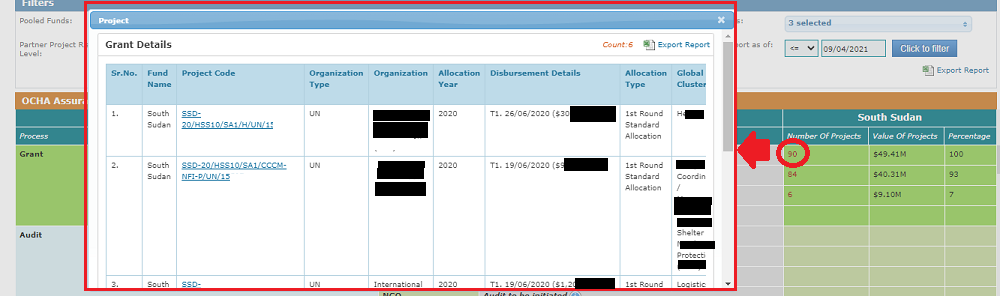
• Values in red are hyperlinks. If you click on the figure, a pop-up window will be displayed, providing additional details with respect to the figure you clicked on.
The data is structured in 8 sections:
- Grant
- Audit
- Interim Financial Reports
- Final Financial Reports
- Progress Narrative Reports
- Final Narrative Reports
- Monitoring
- Financial Spot check
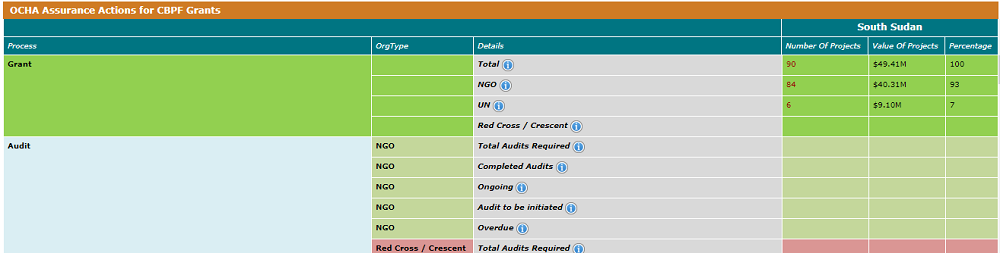
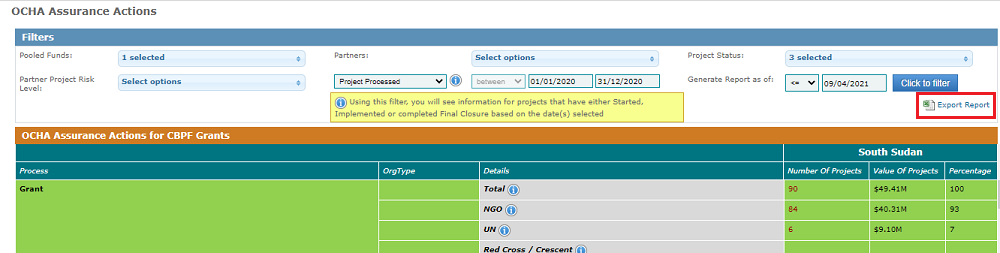
1. Grant
The 'Grant' data shown is purely based on the filters selected at the top. This means that the 'Total Number Projects’ is the total of projects selected for the above displayed Pooled Fund, for the filters selected at the top. This applies for the 'Values of Projects' and 'Percentage' fields.
Note: The 'total' includes 'UN', 'NGO' and 'Red Cross' projects. 'NGO' includes both national and international NGOs.
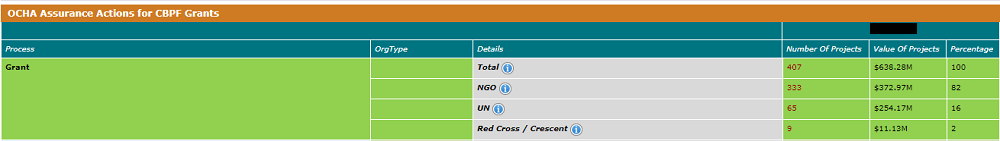
Example with the screenshot above
• Total projects in the Pooled Fund (with respect to the filters applied) are 407 with a total budget of $638.28 M.
• Of these 407 projects, 65 are UN projects of budget value $254.17M, 333 NGO projects of budget value $372.97 M and 9 are Red Cross/Red Crescent Society projects of budget value $11.13M.
2. Audit
Audit indicator displays the total number of projects for which audit has been required, started, completed, is ongoing or overdue. The audit data is displayed in a breakdown between NGOs and Red Cross/Red Crescent Societies. UN Agency data is not displayed as audits are not conducted for UN Agencies.
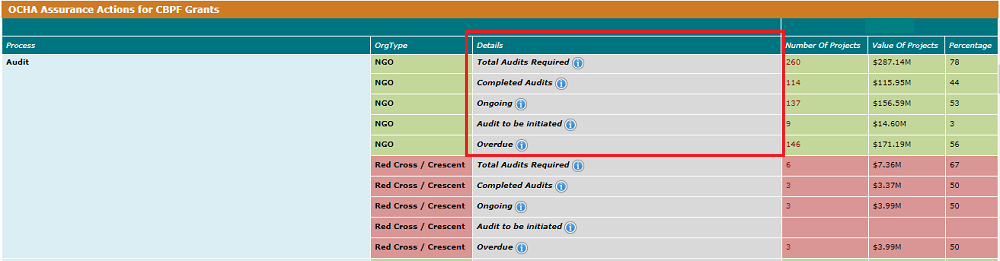
Field Descriptions:
• Total Audits Required: Total number of projects due for Audit (end date plus 7 months) compared with "Generate reports as of" filter. This should include the ongoing Audit, Audit to be started, and Audit completed.
• Completed Audits: Total number of projects audited as of the date set on the filters above.
• Ongoing: Total of projects under Audit process (within 7 months of the end date) as of date set in filters above.
• Audit to be initiated: Audit to be started by the Audit company, for all projects as of the date set on the filters above.
• Overdue: Total number of projects where the audit is yet to be finalized or that has been approved after the end date has passed (end date plus 7 months), as of the date set on the filters above.
Note: Upon clicking on the highlighted red value in the 'Completed Audits' field, the breakdown will highlight Audits completed and approved by CBPF Finance.
Example with the screenshot above (FOR NGOs, in the red square).
• Total of NGO projects due for audits in the Pooled Fund (with respect to the filters applied) are 260, for a total value of US$287.14M.
• Of these 260 required audits, 114 are already completed, 137 are ongoing, 9 still remains to be started.
Of these 260 required audits, 146 were or are overdue.
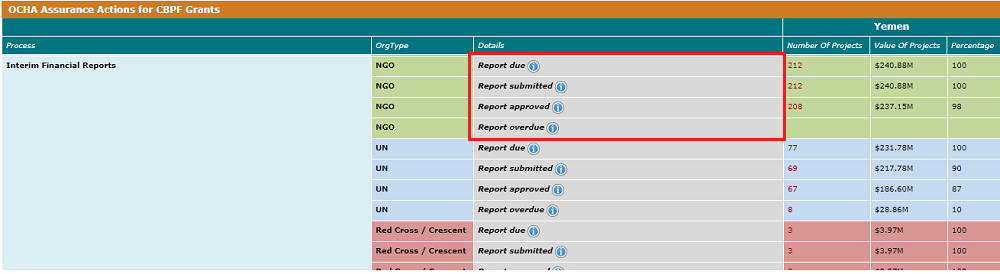
Field Descriptions:
• Report due: Total # of projects for which mandatory Interim Financial Reports due as per the project timeline, as of the date set in the filters above.
• Report submitted: Total # of projects for which mandatory Interim Financial Reports are submitted as per the project timeline, as of the date of the filters set above.
• Reports approved: Total # of Interim Financial Reports approved, that have thus reached end point.
• Reports overdue: Total of projects for which mandatory Interim Financial Reports are not submitted as per the project timeline, as of the date of the filters set above
Example with the screenshot above (FOR NGOs, in the red square).
• Total NGO interim reports required in the Pooled Fund (with respect to the filters applied) are 212.
• Of these 212 required reports, 212 are already submitted, and 208 are approved.
Of these 212 interim reports, 0 were or are overdue.
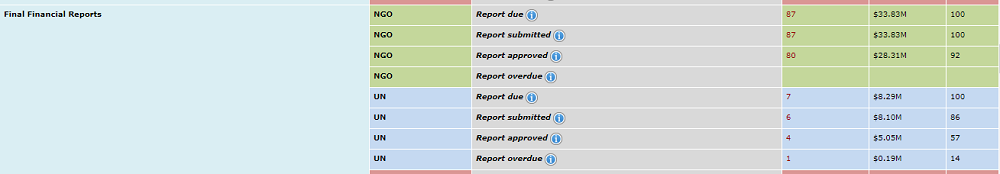
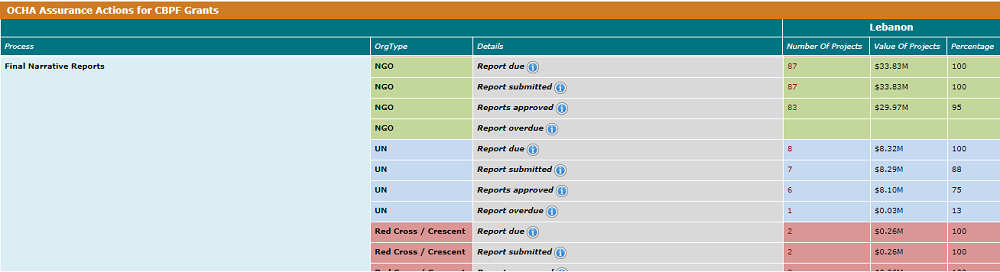
Final Reports (for NGO and Red Cross/Crescent Societies):
• Reports due: Total of projects for which mandatory Final Financial reports due as per the project end date plus 2 months, as of the date of the filters set above.
• Reports submitted: Total of projects for which mandatory Final Financial reports are submitted, as of the date of the filters set above.
• Reports approved: Final Financial reports that have been approved, that have thus reached end point.
• Report overdue: Total of projects for which mandatory Final Financial Reports are not submitted as per the project end date plus 2 months, as of the filters set above.
Final Financial Reports (for UN Agencies):
• Reports due: Total of projects for which mandatory Final Financial reports due as per the 31 May of the year after the project end date (MPTF Fund) or the 30 June of the year after the project end date (non-MPTF Fund).
• Reports submitted: Total of projects for which mandatory Final Financial reports are submitted as of the date of the filters set above.
• Reports approved: Final Financial reports due by 31 May of the year that have been approved, that have thus reached end point.
• Report overdue: Total of projects for which mandatory Final Financial Reports are not submitted as per the 31 May of the year after the project end date (MPTF Fund) or the 30 June of the year after the project end date (non MPTF Fund), as of the filters set above.
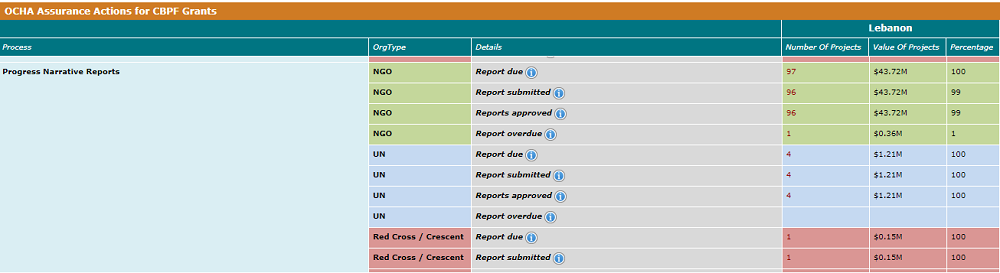
Field Descriptions:
• Report due: Total # of projects for which mandatory Progress Narrative Reports due as per the project timeline, as of the date set in the filters above.
• Report submitted: Total # of projects for which mandatory Progress Narrative Reports are submitted as per the project timeline, as of the date of the filters set above.
• Reports approved: Total # of Progress Narrative Reports approved, that have thus reached end point.
• Reports overdue: Total of projects for which mandatory Progress Narrative Reports are not submitted as per the project timeline, as of the date of the filters set above
Final Reports:
• Reports due: Total of projects for which mandatory Final Financial reports due as per the project end date plus 2 months, as of the date of the filters set above.
• Reports submitted: Total of projects for which mandatory Final Financial reports are submitted as of the date of the filters set above.
• Reports approved: Final Financial reports that have been approved, that have thus reached end point.
• Report overdue: Total of projects for which mandatory Final Financial Reports are not submitted as per the project end date plus 2 months, as of the filters set above
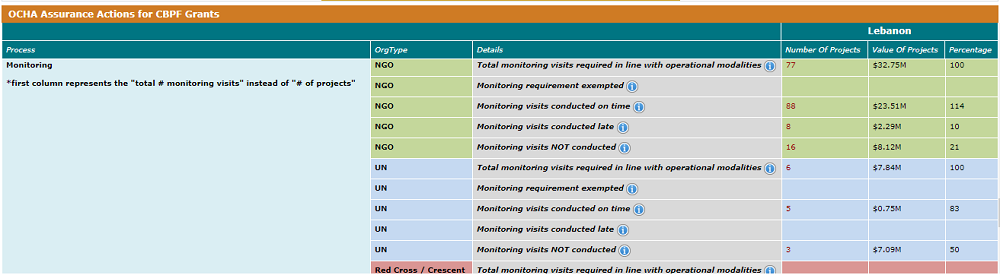
Field Descriptions:
• Total monitoring visits required in line with operational modalities: Total monitoring visits required as per the Operational Modalities (OM) for Projects past the actual end date (few projects may require multiple monitoring visits).
• Monitoring visits exempted: Total monitoring visit requirements exempted (i.e. justification for Non-requirement or cancellation of OM required monitoring has to be provided)
• Monitoring visits conducted on time: Total monitoring visits conducted on time (i.e. within the project end date) as per the completion date of the visit. It may include additional monitoring visits to those mentioned in the operational modalities (few projects may require multiple monitoring visits).
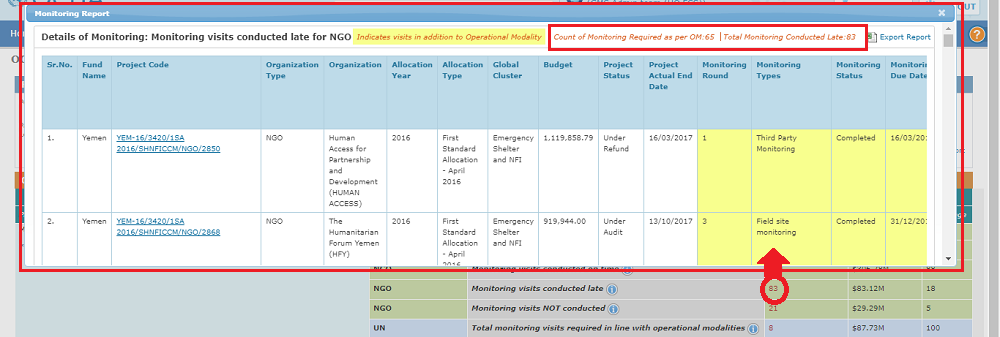
• Monitoring visits conducted late: Total number of monitoring visits which were conducted but after the due timeframe (i.e. as per the project end date). It may include additional monitoring visits to those mentioned in the operational modalities (few projects may require multiple monitoring visits).
• Monitoring not conducted: Total number of monitoring visits which were not conducted within the due timeframe of the project end date.
Note: The Due Date for the monitoring is considered as the project end date, and not the due date set in the project timelines. The monitoring end date is picked up from the monitoring report form.
Example with the screenshot above (FOR NGOs).
• Total NGO monitoring visits required by the OM in the Pooled Fund (with respect to the filters applied) are 77.
• For the combination of both required and additional monitoring visits, 0 were exempted, 88 were conducted on time, 8 were conducted late and 16 were not conducted.
88 + 8 + 16 = 112 = number of total monitoring visits planned in the Timelines (both the required (77) and the additional)
To learn more on how to distinguish between the required and additional monitoring instances, please read the very below :
When clicking on the red figures in the ‘Monitoring visits conducted on time/late’ the pop-up window will highlight in yellow the visits that were not required as per the OM (i.e. additional visits).
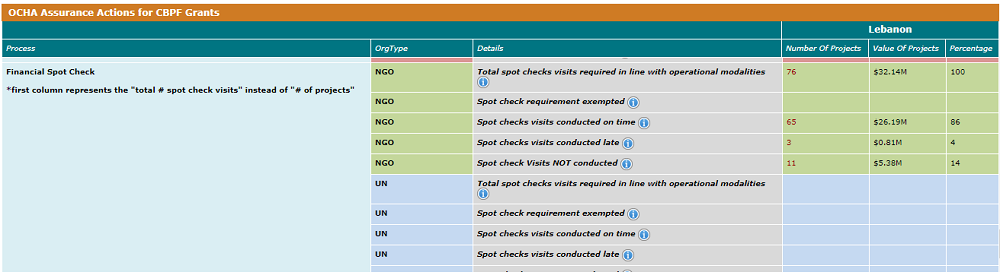
Field Descriptions:
• Total spot checks visits required in line with operational modalities: Total spot check visits required as per the Operational Modalities for Project past the actual end date (few projects may require multiple spot check visits)
• Spot checks requirement exempted: Total Spot check visit requirements exempted (i.e. justification for Non-requirement of cancellation of OM required spot check has been provided)
• Spot checks visits conducted on time: Total spot check visits conducted on tim (i.e. within project actual end date) as per the completion date of the visit. It may include additional spot check visits as per the Operational Modalities (few projects may require multiple spot check visits).
• Spot checks visits conducted late: Total # of spot check visits which were conducted but after the due timeframe i.e. project end date. It may include additional spot check visits as per the Operational Modalities (few projects may require multiple spot check visits)
• Spot checks visits not conducted: Total # of Spot check visits which are NOT conducted within the due timeframe of project end date.
Note: Like the Monitoring process, when clicking on the red figures of the lines ‘conducted in time/late’, in the pop-up window, the additional spot check visits that were conducted but not required per the Operational Modality are highlighted in yellow.
IV) How to extract the data as an Excel sheet? Top
The data displayed to the user can be downloaded in an excel format using the [Export to Excel] button to present on the right-hand corner of the screen.
All pop-up windows which provides additional information can also be downloaded as Excel Sheets, by clicking on [Excel Report].
which provides additional information can also be downloaded as Excel Sheets, by clicking on [Excel Report].