I. $ Fund Overview
i. What is the $ Fund Overview report on GMS?
ii. How to access the $ Fund Overview report on GMS?
iii. How to generate the $ Fund Overview report on GMS?
II. $ Fund Balance
WHAT IS THE $ FUND OVERVIEW REPORT ON GMS
The $ Fund Overview Report provides the user with a breakdown of projects per allocation, along with the various cost tracking components associated with an allocation type. It includes, per allocation, the following information:
- the total number of projects approved by the Humanitarian Coordinator (HC) per allocation,
- the total US$ amount disbursed to date,
- the total cost to Fund planned vs actual, and
- the other cost tracking components linked to the allocation, namely: project budget without PSC, PSC cost, audit charges, MA charges, and total reimbursement from partner.
HOW TO ACCESS THE $ OVERVIEW REPORT ON GMS
To access the $ Fund Overview Report, follow this navigation: Report > Report > $ Fund Overview.

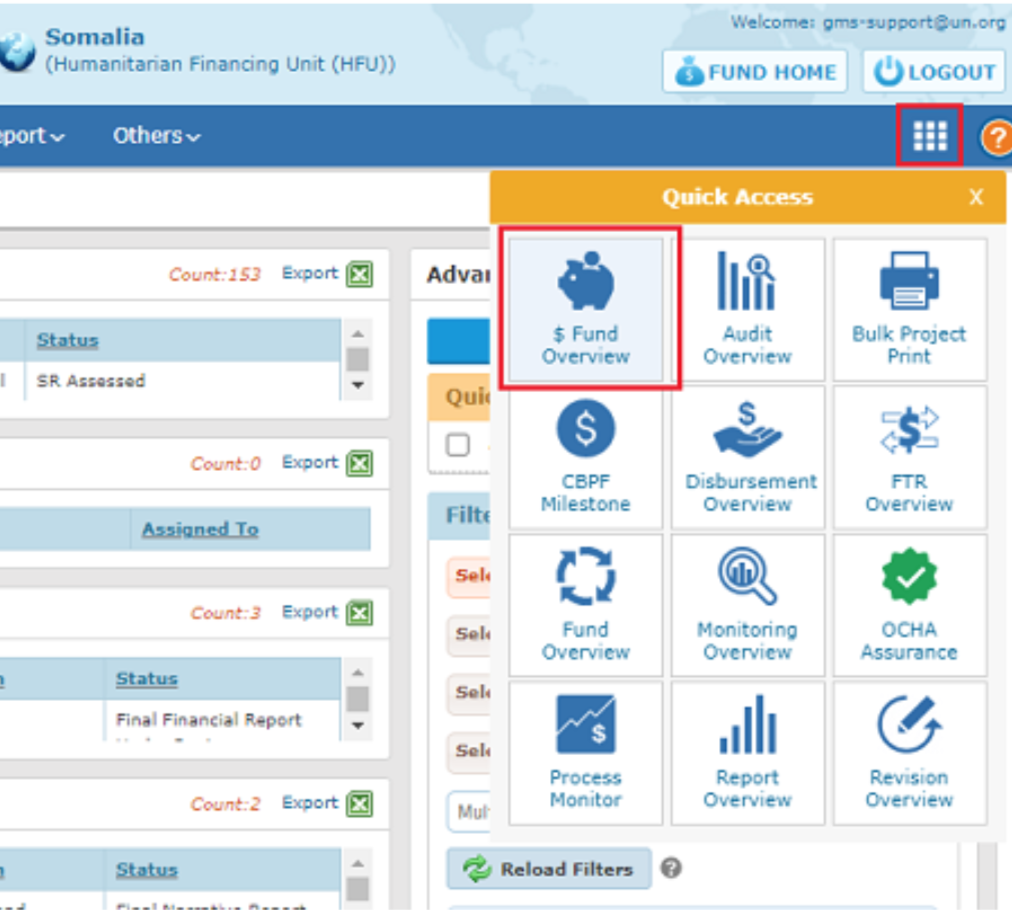
You can also access it through the Quick Access on the right-hand side of the menu bar.
HOW TO GENERATE THE $ FUND OVERVIEW REPORT ON GMS
You can apply filters to see only the content you wish to access. By default, the $ Fund Overview provides the users a view of the overall costs for all allocations.

Filters Description:
- Allocation Year (drop down box): Lists the years of allocation available in the GMS system for the pooled fund.
- Allocation Source (drop down box): Lists the allocation sources for the pooled fund (i.e. Reserve, Standard and SharePoint).
- Cluster (drop down box): Lists the clusters defined for the pooled fund.
- Organization Type (drop down box): Lists Organization Types in the pooled fund (International NGO, National NGO, Other, UN Agency).
- Organization (drop down box): Lists organizations registered for the pooled fund.
- Status (drop down box): Lists the type of allocation source and the project status.
You can apply your desired filters, then click on the Search button to generate the $ Fund Overview. Click the Clear Filters button to reset the filters.
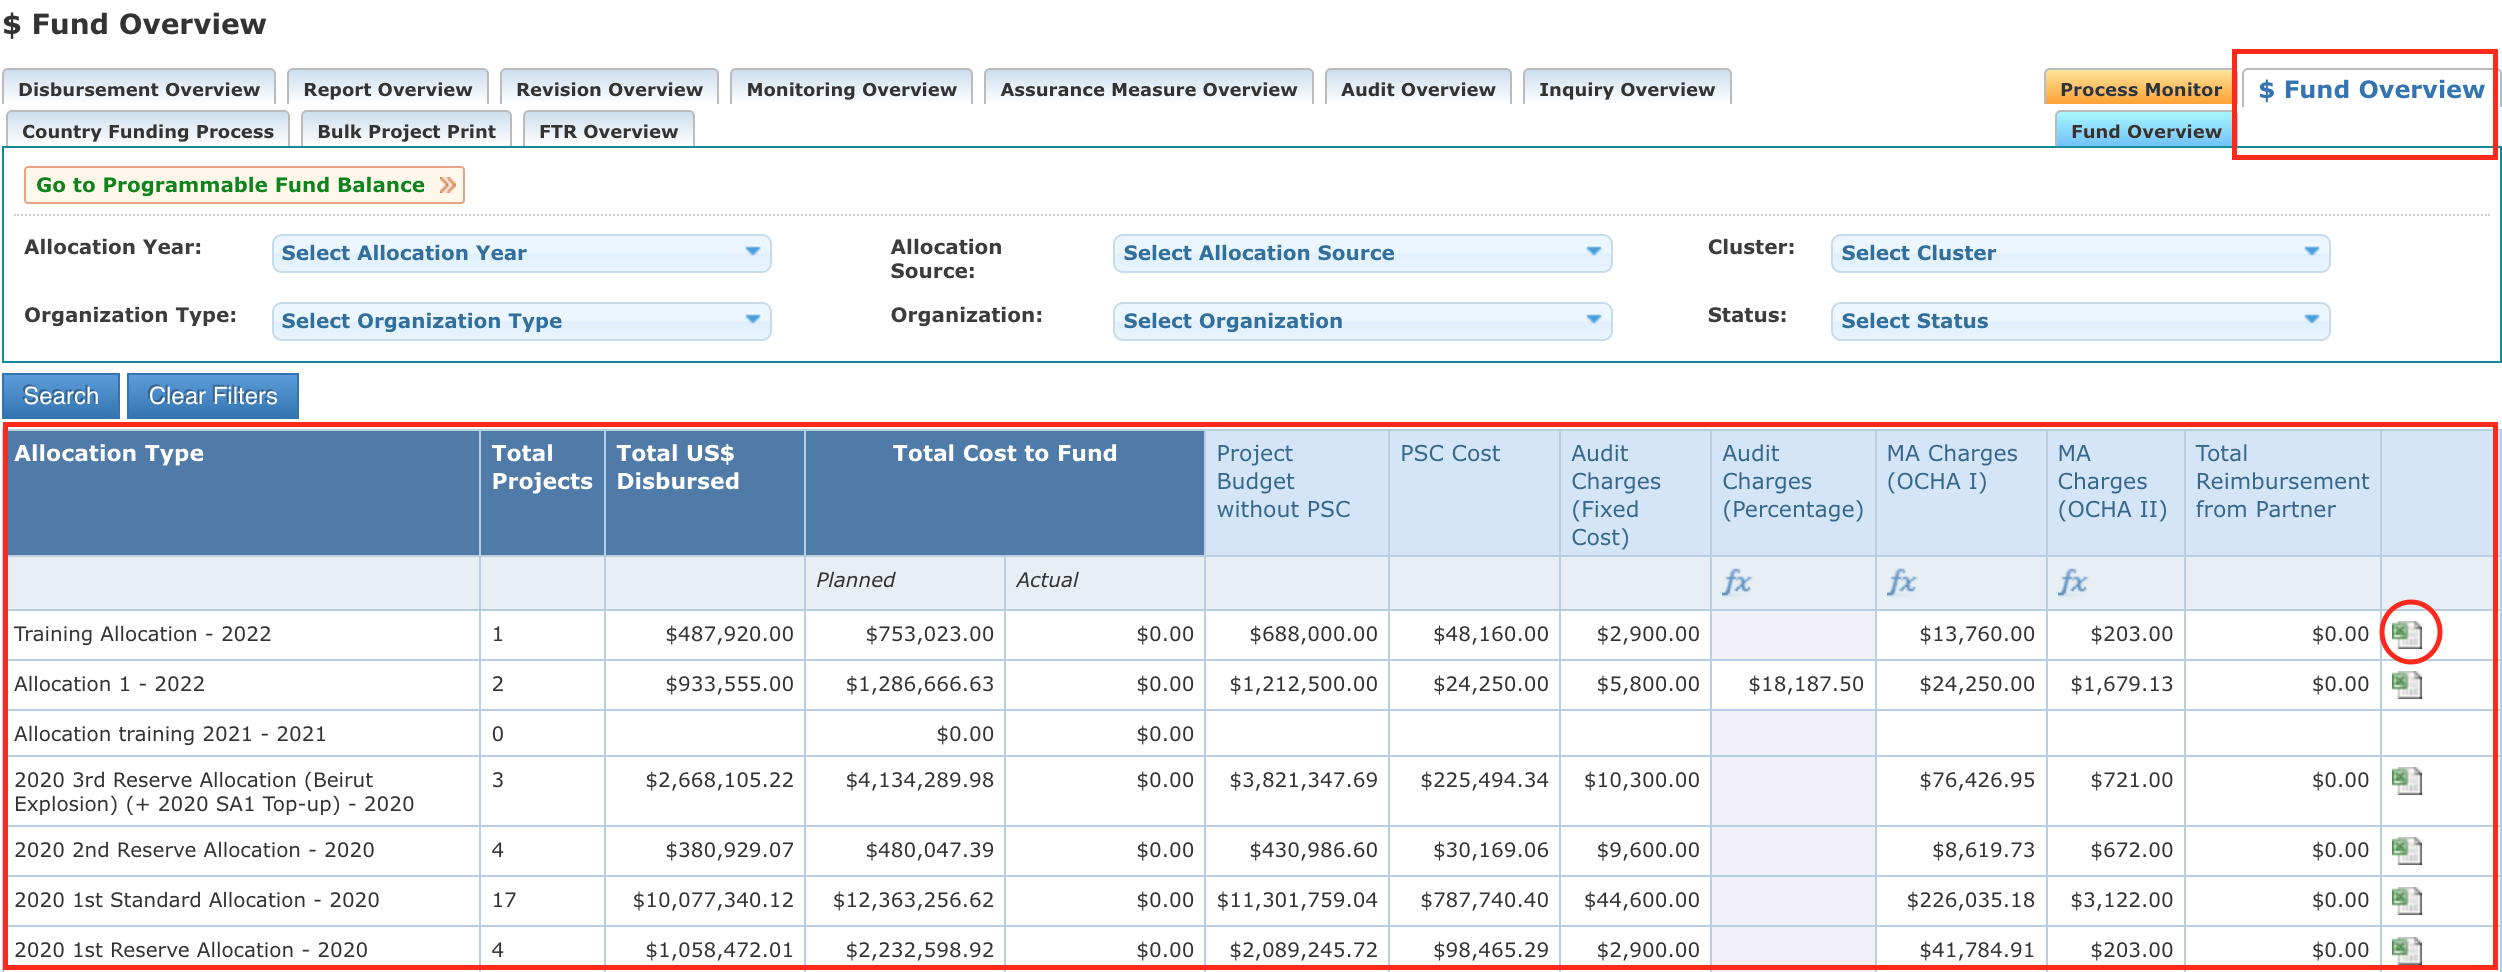
Column's description:
- Allocation type: Name of the Allocation.
- Total Projects: Number of projects approved by the HC to date.
- Total US$ Disbursed: Total of funding disbursed (in US$) to date.
- Total Cost to Fund:
- Planned: Total sum of the cost tracking components found in the table (planned values): Project Budget without PSC, PSC Cost, Audit Charges, MA Charges (OCHA I and II).
- Actual: Actual total cost to Fund calculated automatically by the GMS based on the Project Closure tab in each project.
- Planned: Total sum of the cost tracking components found in the table (planned values): Project Budget without PSC, PSC Cost, Audit Charges, MA Charges (OCHA I and II).
- Actual: Actual total cost to Fund calculated automatically by the GMS based on the Project Closure tab in each project.
- Project Budget without PSC: Sum of approved projects’ budgets without PSC costs included within the allocation.
- PSC Cost: Sum of all PSC costs of approved projects within the allocation.
- Audit charges (Fixed cost): Sum of all audit charges that were configured as fixed costs of approved projects.
- Audit charges (Percentage): Sum of all audit charges configured as percentage of approved projects.
- MA charges (OCHA I): Total OCHA PSC on Projects (calculated based on a formula against a planned value, usually 2% of total Project Budgets without PSC).
- MA charges (OCHA II): Total OCHA Charges on Project Audit (calculated based on a formula against a planned value, usually 7% of total Audit Charges).
- Total Reimbursement from Partner: Sum of all refunds by Partners (to date).
You can export one allocation’s data as an Excel sheet by clicking on the Excel icon at the end of its line. The Excel will include the project-level details with their cost tracking components for each allocation type.
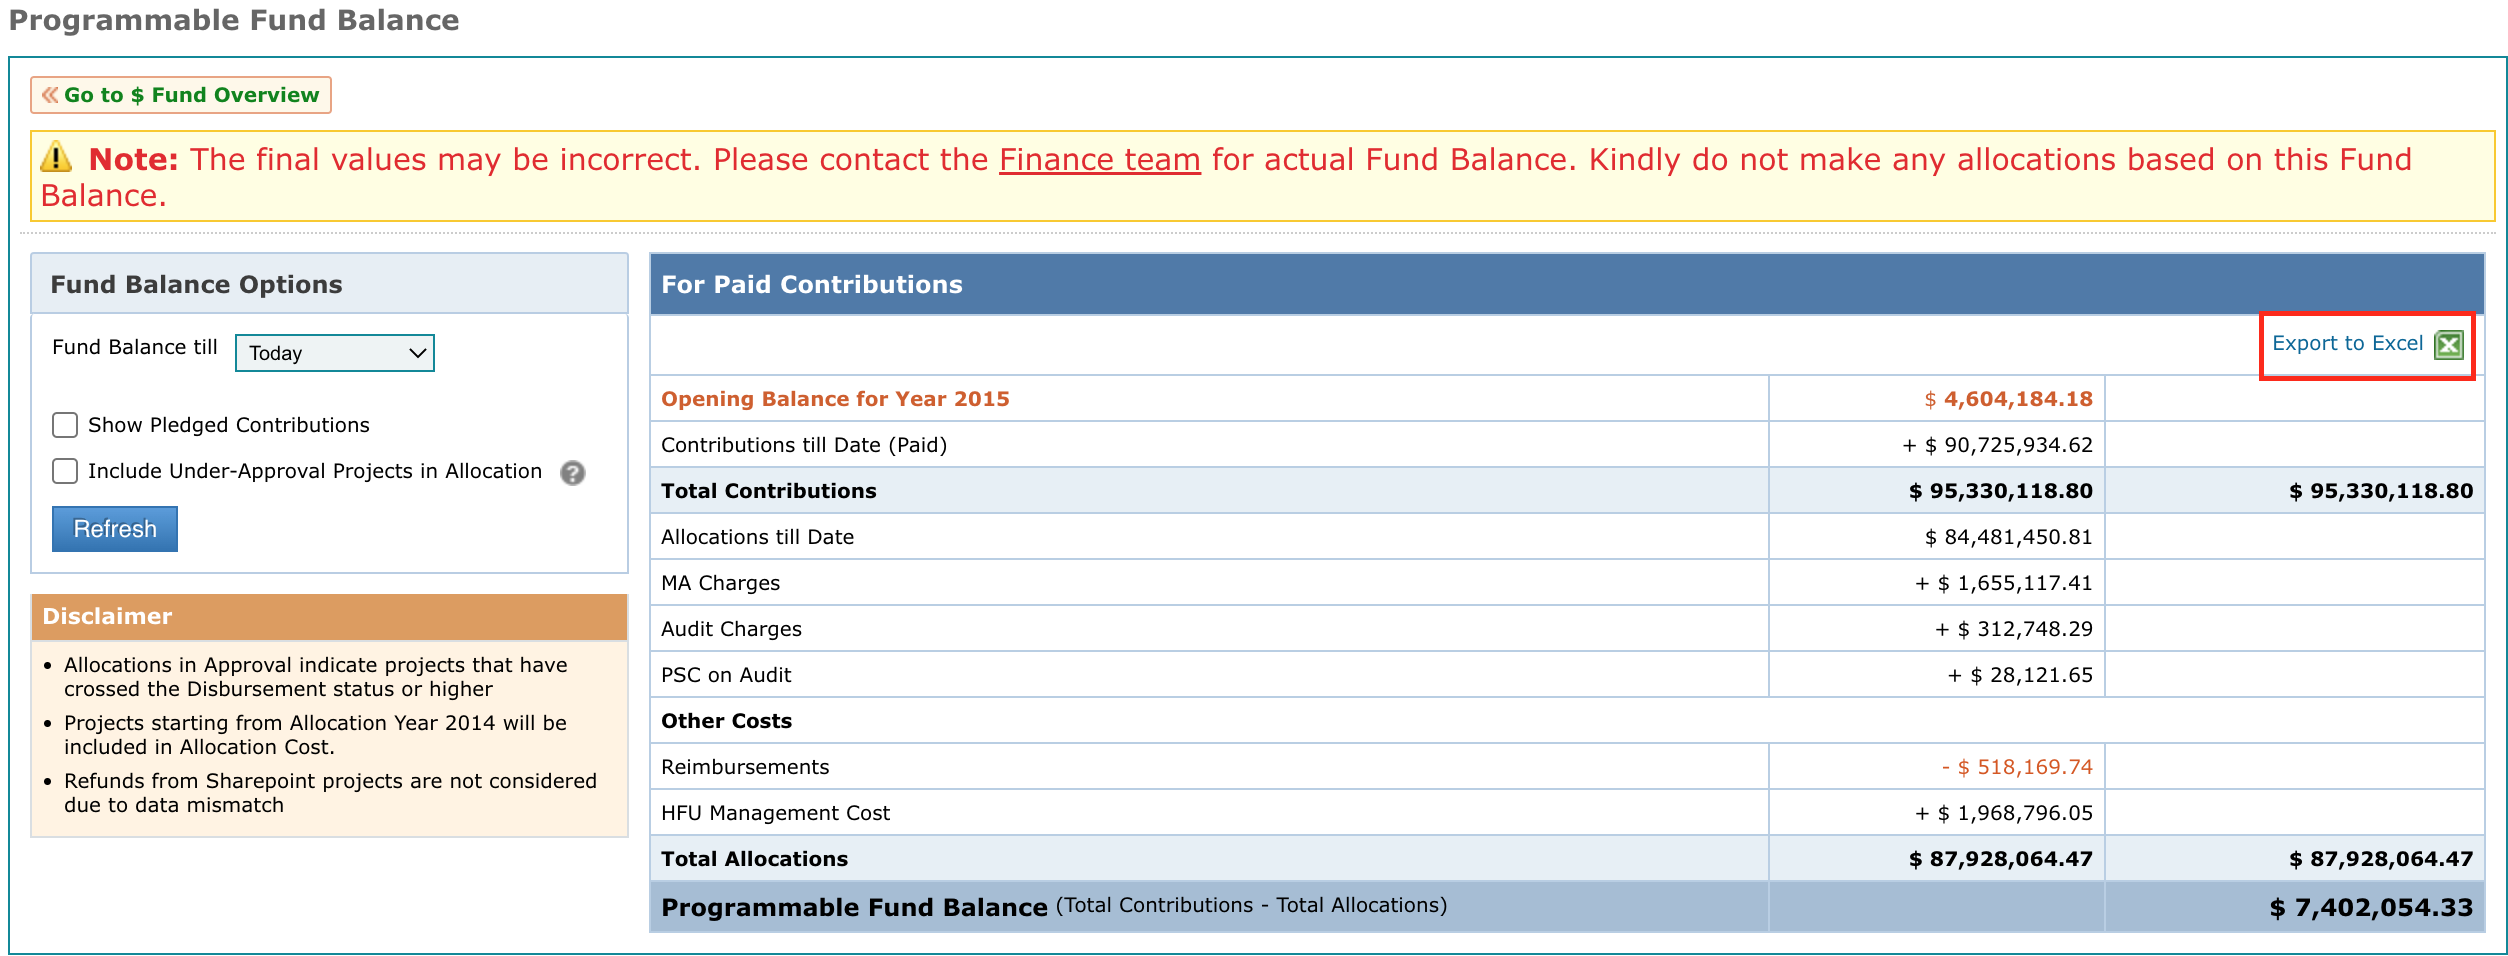
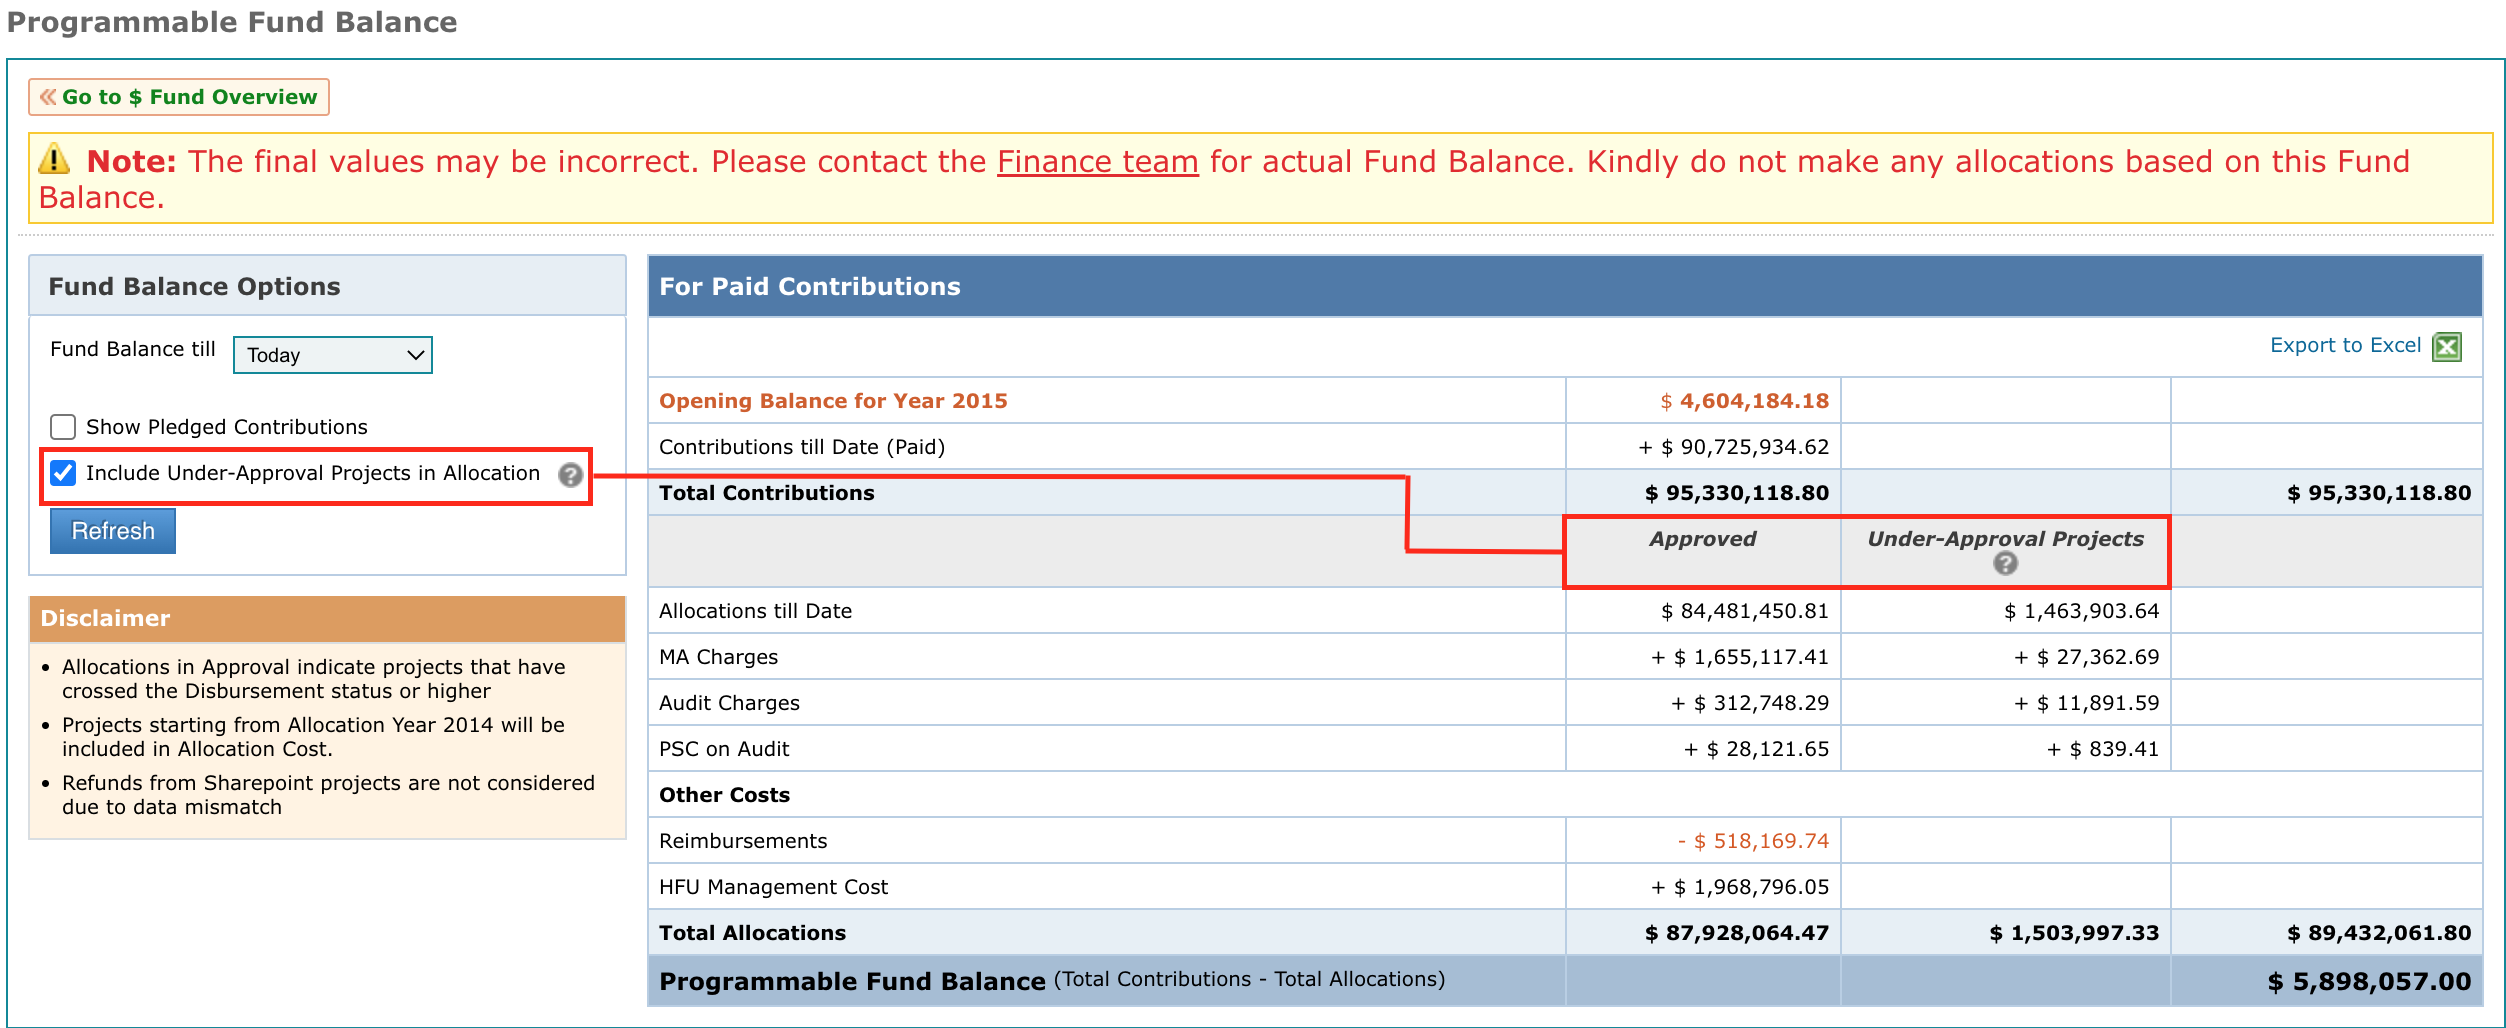
The Programmable Fund Balance displays the balance of funding for a specific pooled fund.
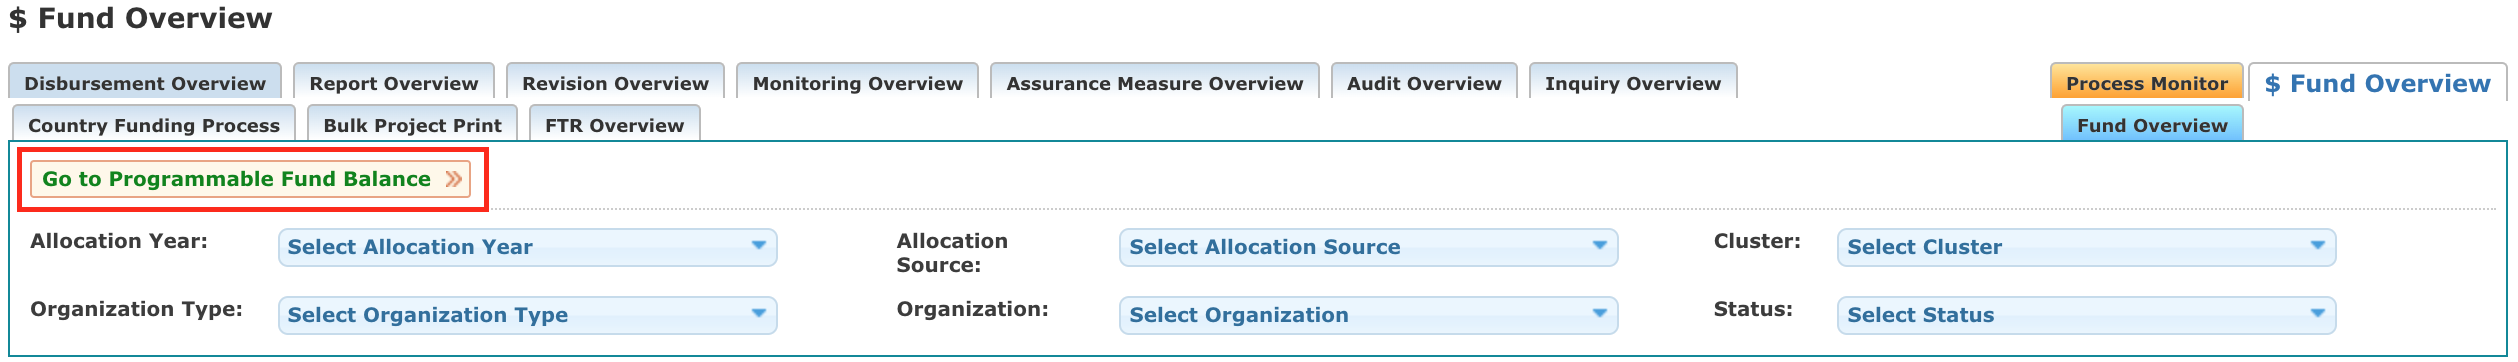
The Programmable Fund Balance report can be accessed through the $ Fund Overview, by clicking on [Go to Programmable Fund Balance], present just above the filter section.
By default, the data will be displayed for the current date and year.

Select one or more filters present on the left-hand side of the page if you wish the change the filter criteria.
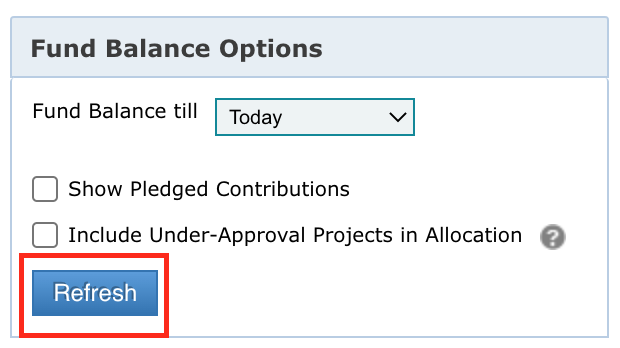
Filters Description:
- Fund Balance till (drop down box): Lists the years available in the pooled fund for which the user can fetch the fund balance information. By default, the current date and year is selected.
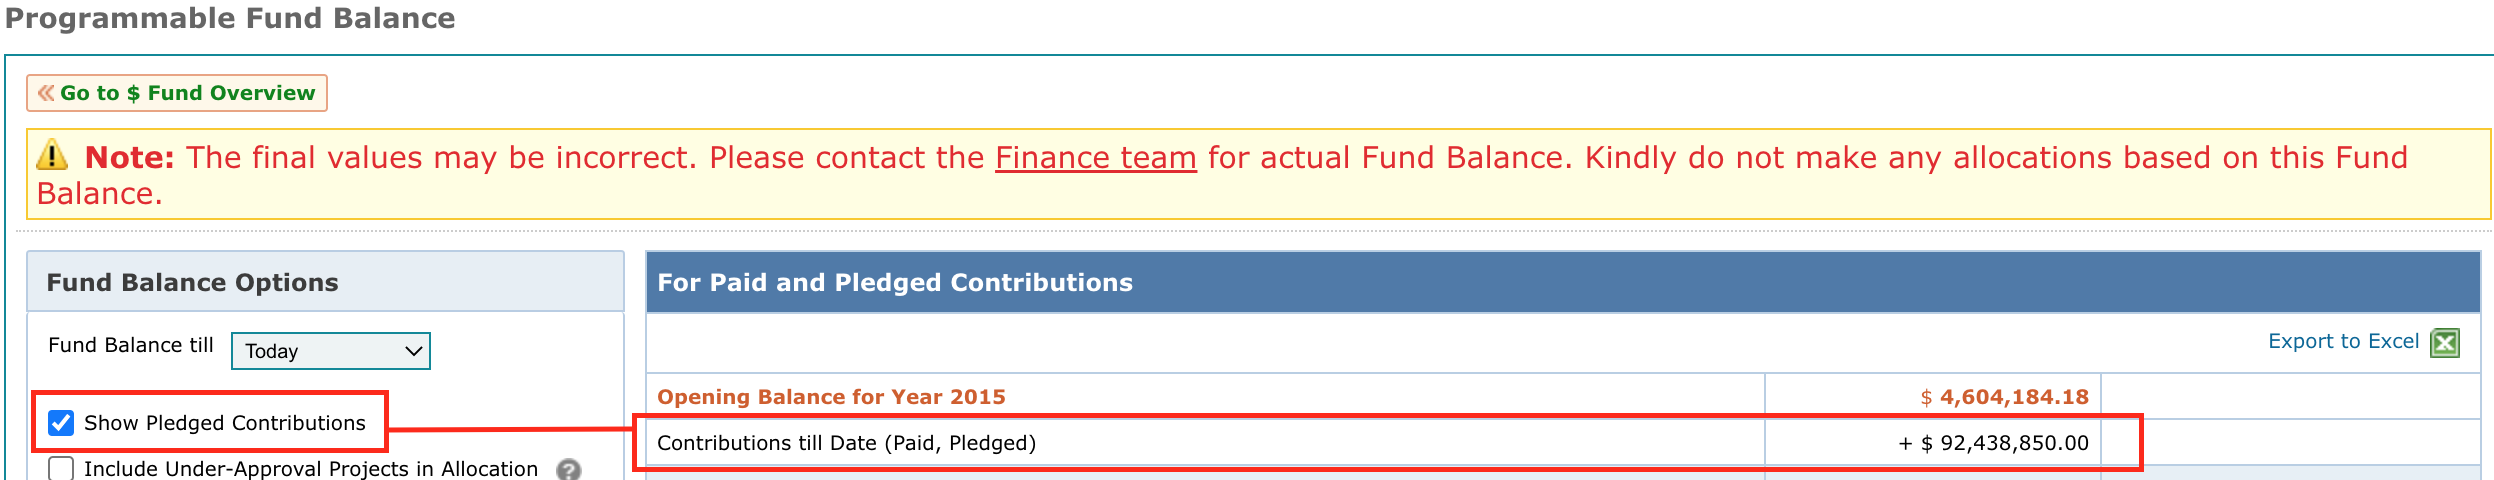
- Show Pledged Contributions (checkbox): On selection, the value of pledged contributions will be included with the “Fund Balance till” date value to show a total of Contributions till date (Paid and Pledged).
- Include Under-Approval Projects in Allocation (checkbox): On selection, the user would be able to view the value of allocations that are currently under-approval. “Under Approval” means projects that are between “Under TR CC/Specialist” status and “Disbursement” status and reached the status on or before the date filter specified in “Fund Balance till” date.
Note: Projects in “Disbursement” status will be excluded from Under-Approval as the same is already considered in “Approved” project allocation cost.
Click on [Refresh] to apply the selected filters.
You can export the Fund Balance data as an Excel Sheet by clicking on [Export to Excel].
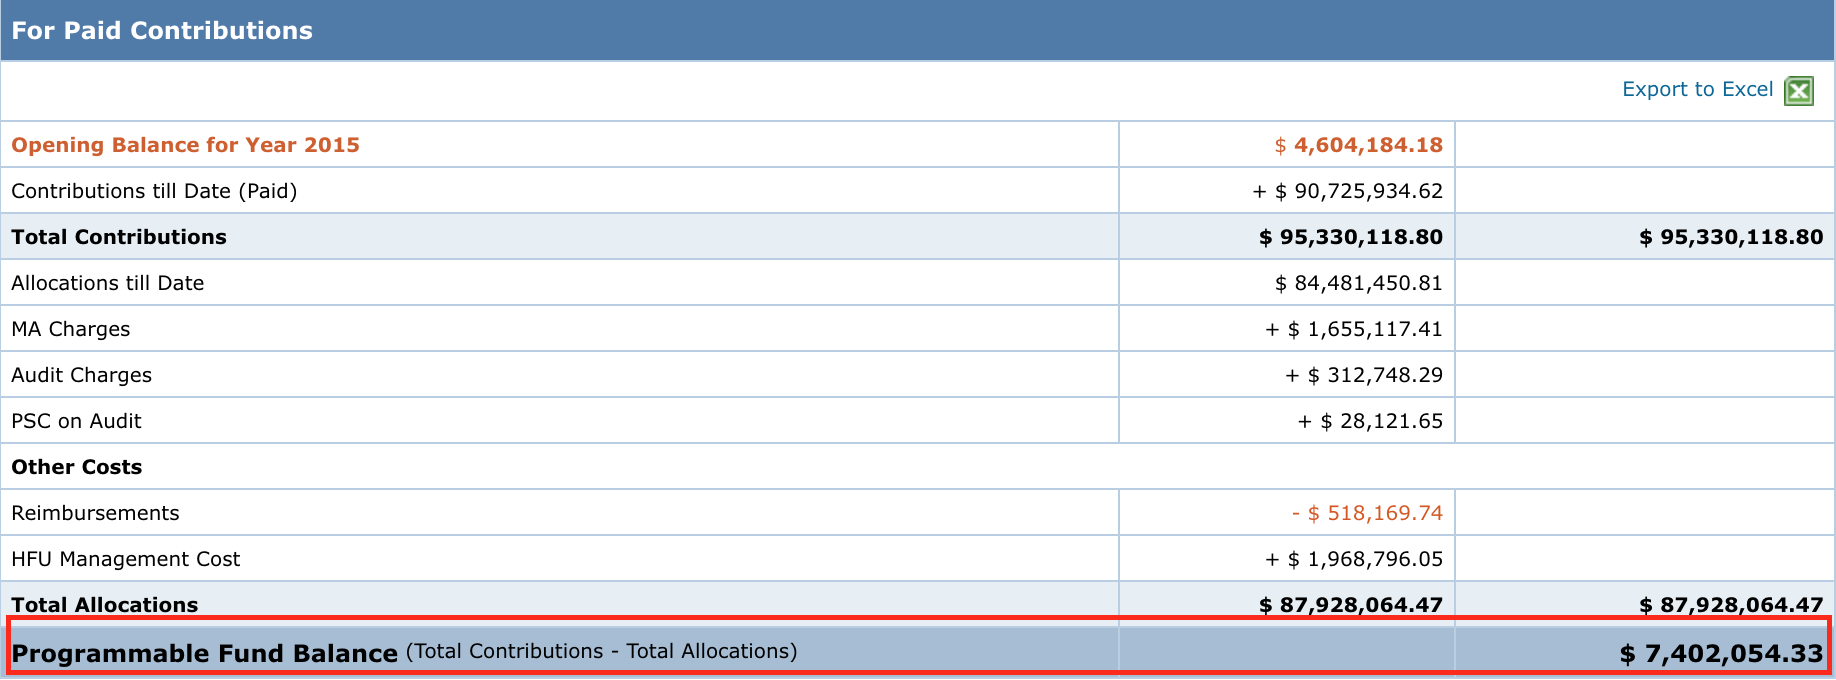
You can find below the detailed description of each row of this table:
Opening Balance for Year XXX
![]()
Displays the year during which the opening balance was configured for the pooled fund with pooled fund’s opening balance amount displayed.
Note:
- If, the opening balance is not configured for the pooled fund, this row will not be displayed.
- For pooled funds having opening balance configured, then all data related to contributions and allocations will be from the start of the opening balance year.
For example, if a pooled fund has an opening balance for year 2015, then contributions and allocations made from 1st January 2015 will be considered. Contribution and allocation data prior to this date will be excluded as the same would have been used to compute the opening balance.
Contributions till Date (Paid)
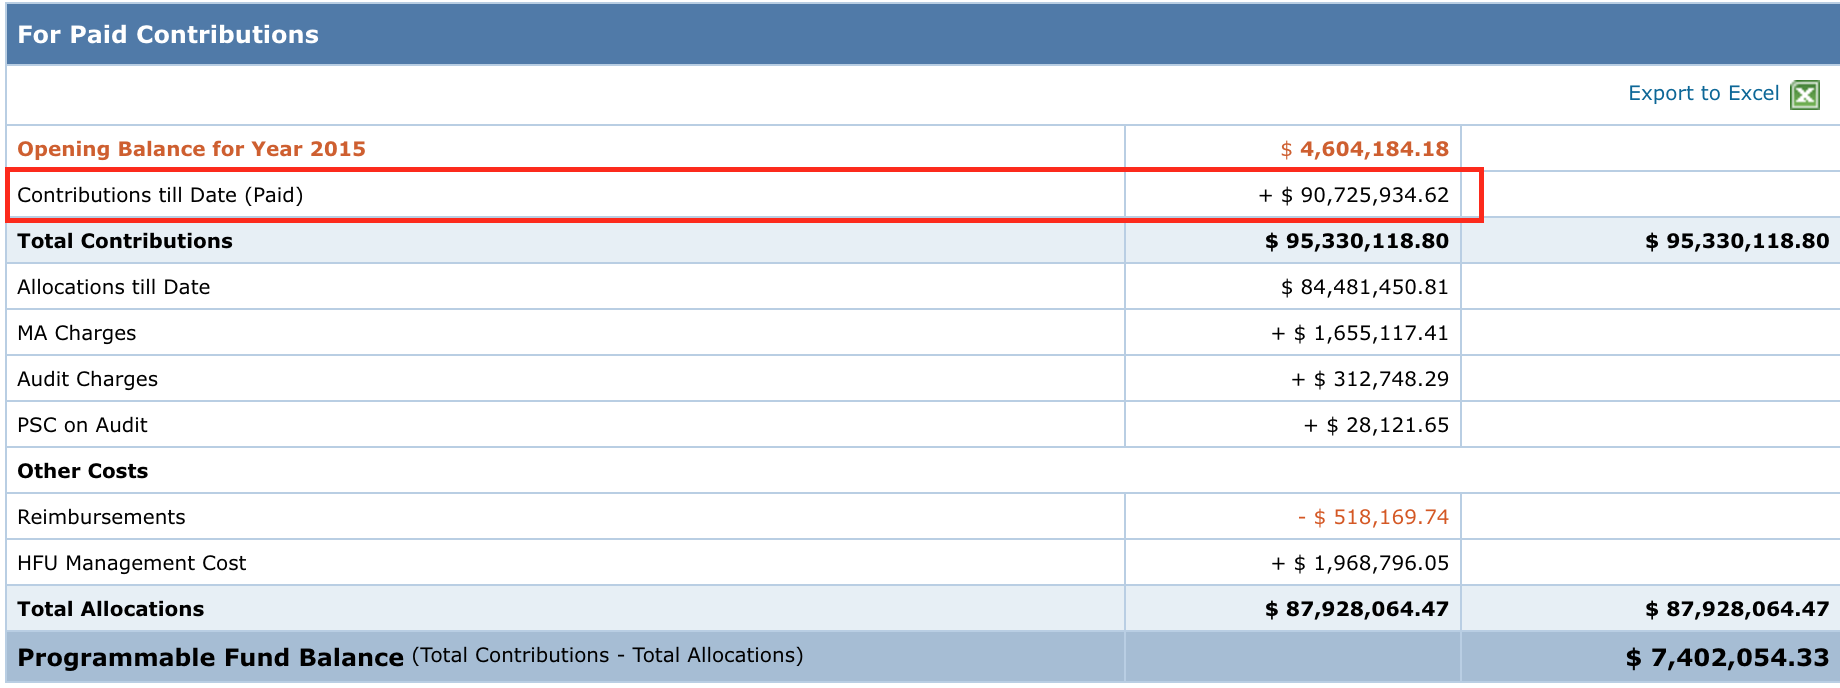
By default, will display the total contributions that have been “Paid” as per the Fund Balance Year selected.
-
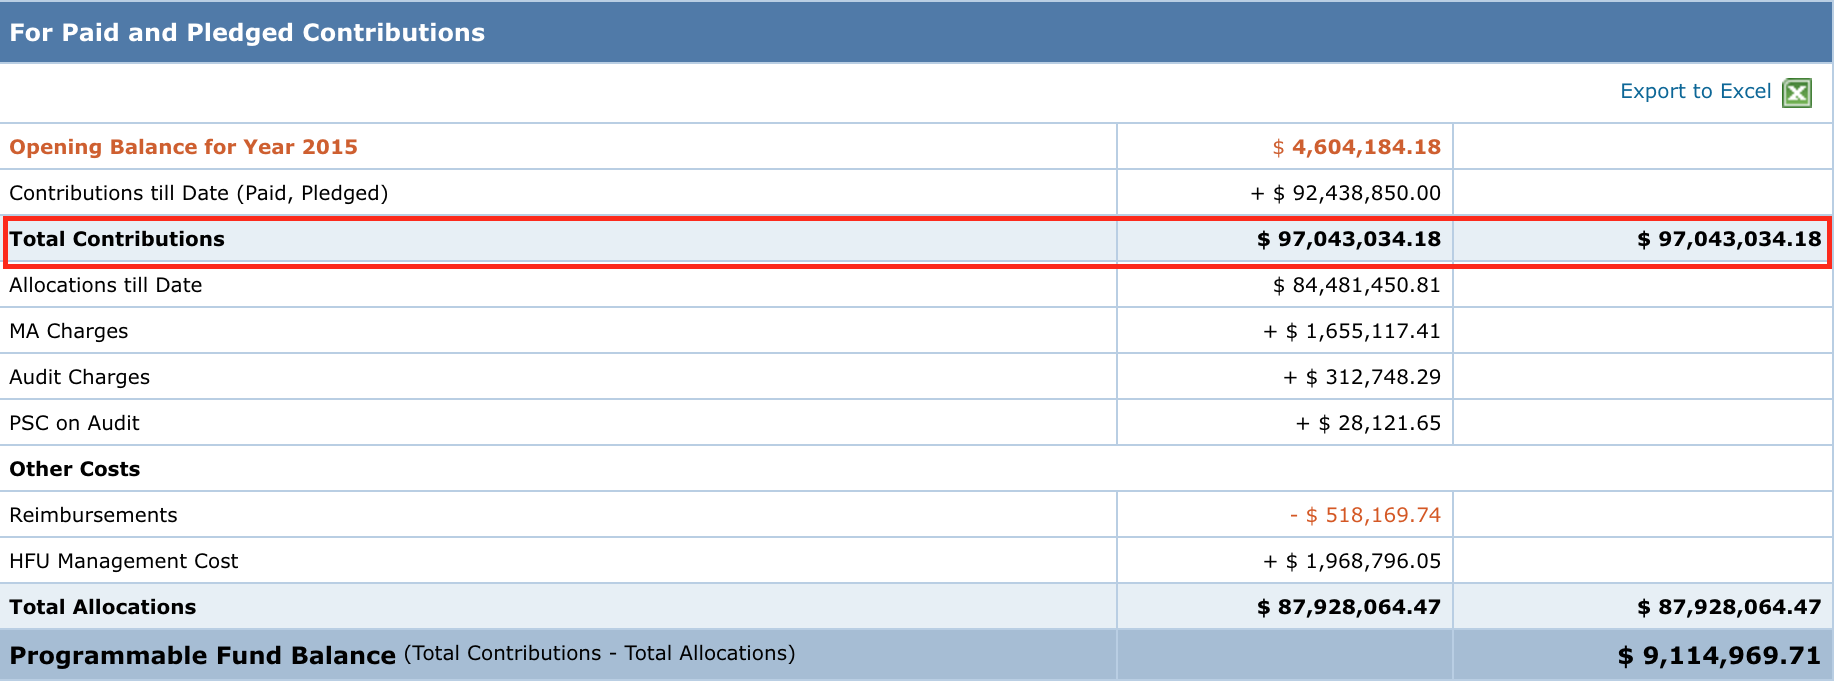
If, “Show Pledged Contributions” option is ticked in the filter section, the value displayed here would be a total of the Paid and Pledged contributions.
Total Contributions
Displays the total value of Opening Balance (if configured) and Contributions (paid and pledged (if option selected)).
Approved and Under-Approval Projects
This row will be visible only if the “Include Under-Approval Projects in Allocation” option is ticked in the filter section. This row is displayed having two sub headers titled ‘Approved’ and ‘Under-Approval projects’.
Note: All values displayed under “Approved” and “Under-Approval” will be computed using the below-mentioned logic (unless specified differently).
-
“Approved” sub-header
Displays value for projects that have reached / crossed “Disbursement” status. Certain conditions which need to be fulfilled for an accurate display of data under the “Approved” sub-header are:
- For MPTF based Pooled Funds:
In MPTF based Pooled Funds (Afghanistan, Sudan, South Sudan, DRC, CAR and Somalia) the following sequence of date filters will be followed to identify the projects:
- FTR Payment Date – For Paid Amount greater than 0 the first FTR Payment date will be considered.
- 1st Disbursement Date – For projects that do not hold the FTR Payment Date, the 1st Disbursement Date will be used as the date filter.
- Last-In Date of earliest approval status – In cases where both FTR Payment Date and 1st Disbursement date are not available then.
- The Last-In date of the earliest “Disbursement” or higher status is considered meaning the first status in the workflow log where the project has moved to a status of “Disbursement” or higher.
- For non-MPTF based Pooled Funds:
- 1st Disbursement Date – For projects that do not have the workflow Date, the 1st Disbursement Date will be used as the date filter.
- Last-In Date of earliest approval status – The Last-In date of the earliest “Disbursement” or higher status will be considered first.
| Note: Ideally, this should be the “Disbursement” status, but in certain cases, there are projects moving from “Under Approval” status directly to “Implementation and Reporting” status without passing through the Disbursement status. In such cases, the Last-In date of “Implementation and Reporting” status in the workflow log will be taken into account. |
- For Sharepoint Projects,
Data from projects that are currently in / have crossed the “1st Disbursement” Status and the “Date of Disbursement of funds from UNOG to Partner” has to between the date filter will be considered for calculation of Allocation data.
Note: Sharepoint Projects will have no impact on the calculation of Contributions data.
-
Under “Under-Approval” sub-header
Displays value for projects that are between “TR Draft” status and before “Disbursement” status and reached the status on or before the date filter specified in “Fund Balance till Year”. Additionally, specific pre-configured status that indicate that the project is not approved or has been withdrawn will be excluded.
Note: Projects in “Disbursement” status will be excluded from Under-Approval as the same is already considered in “Approved” column.
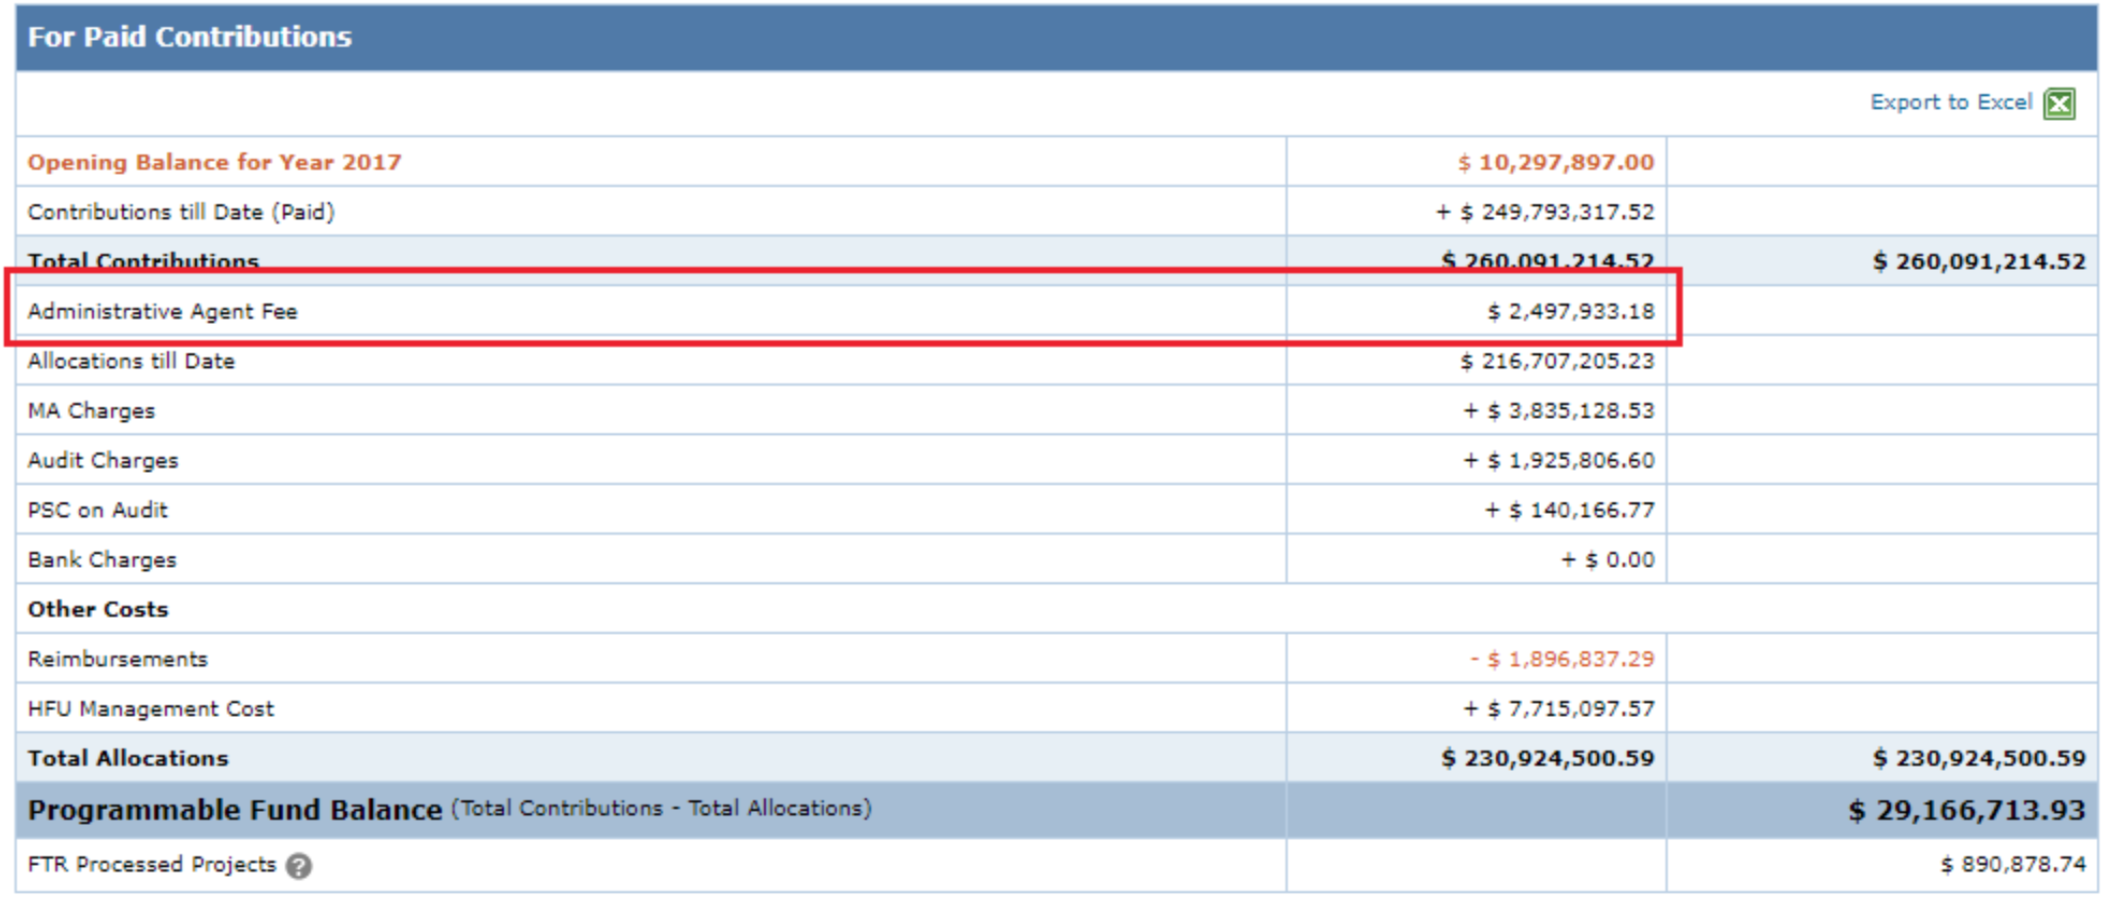
Administrative Agent Fee
Displayed only if the type of the pooled fund is “MPTF”. This value would be computed as 1% of Paid Contributions value.
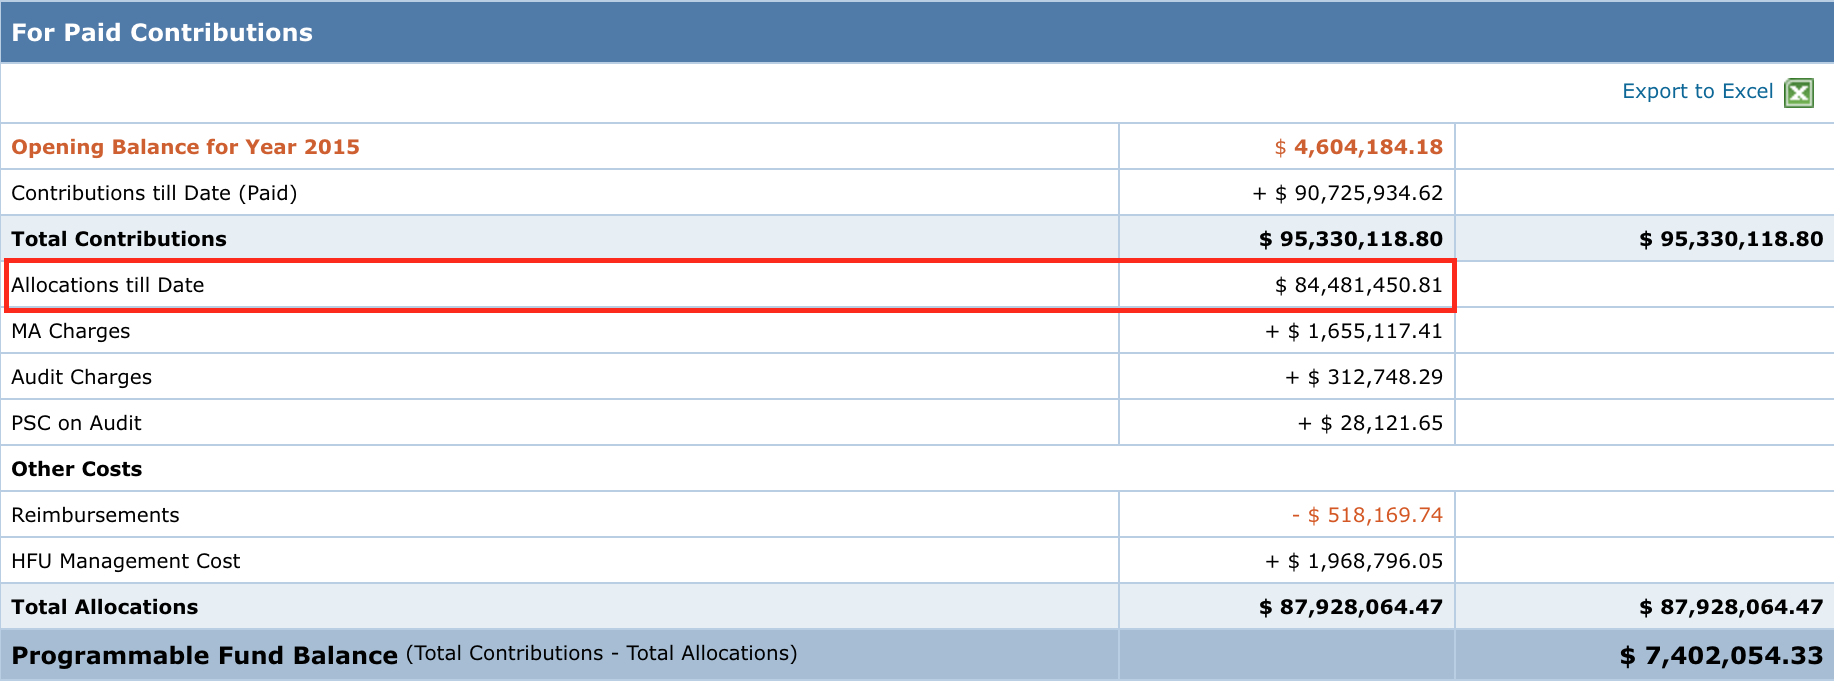
Allocations till Date
Displays the total budget amount (Approved Budget + PSC Cost) for the approved projects up until the date inserted in “Fund Balance till” filter.
Note:
- If the project has actual values, then they will be considered. Otherwise, the Planned / Approved Budget values will be used for computation.
- For Sharepoint projects, the “Total Expenditure Cleared By ASB” field value (Actual Value from “Ext. Audit By ASB” tab) is used to get the allocation amount. In case this amount is 0, then the “Approved Budget” amount is used.
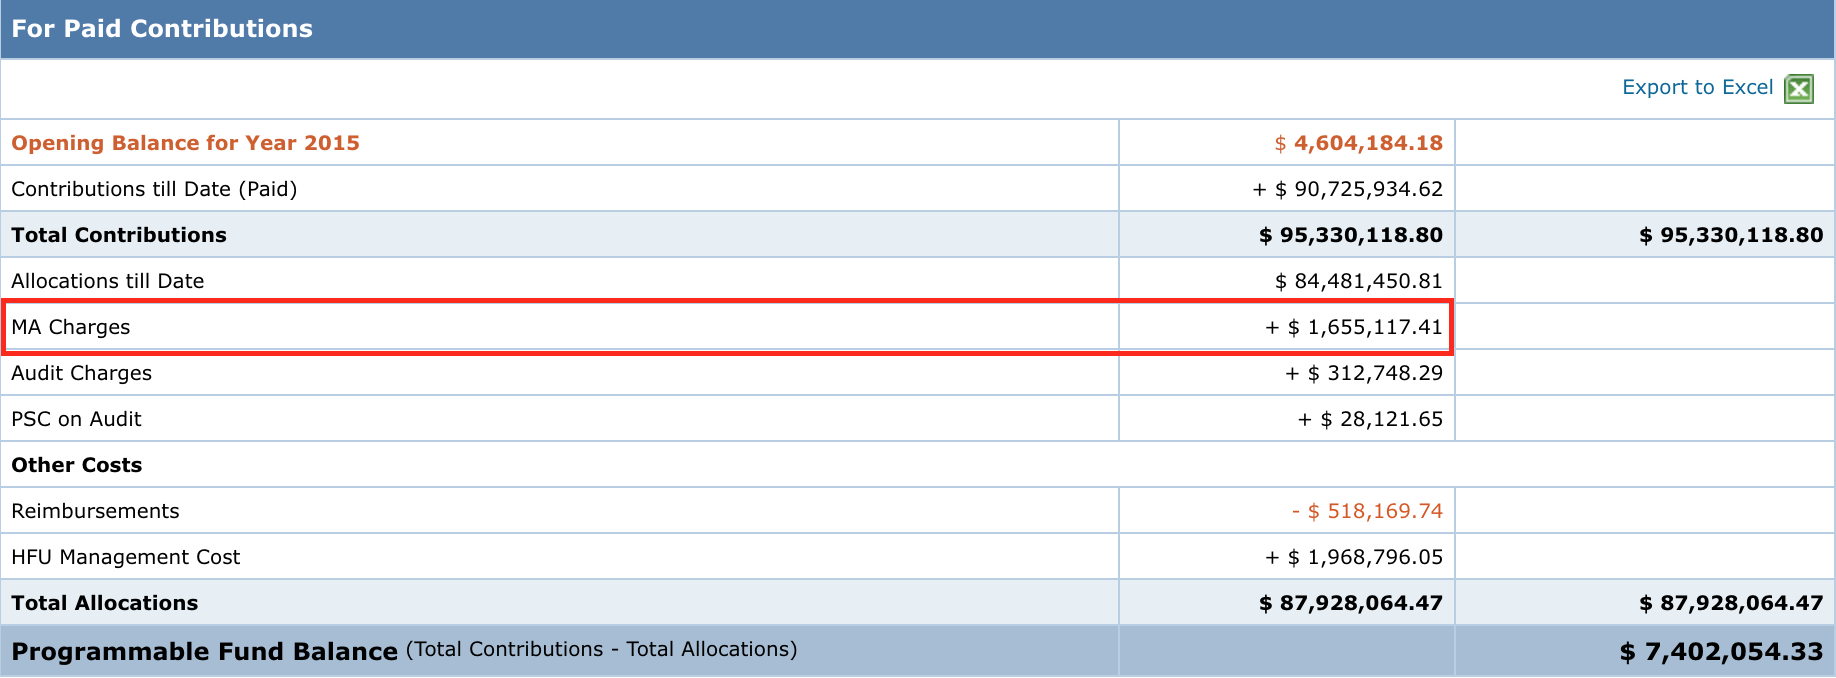
MA Charges
Displays the total of Cost Tracking Component “MA Charges 1”.
Note:
- In the absence of an actual value in the project (given by the HFU at project closure), the Planned Value will be used.
- For Sharepoint Projects, the “PSC” field value (Actual Value from “Closure” tab) is used to get the MA Charges amount. In case this amount is 0, then it would be computed as 7% of the “Approved Budget” amount.
Audit Charges
Displays the Cost Tracking components’ “Audit Charges (Fixed Cost)” or “Audit Charges (Percentage)” as configured for the projects.
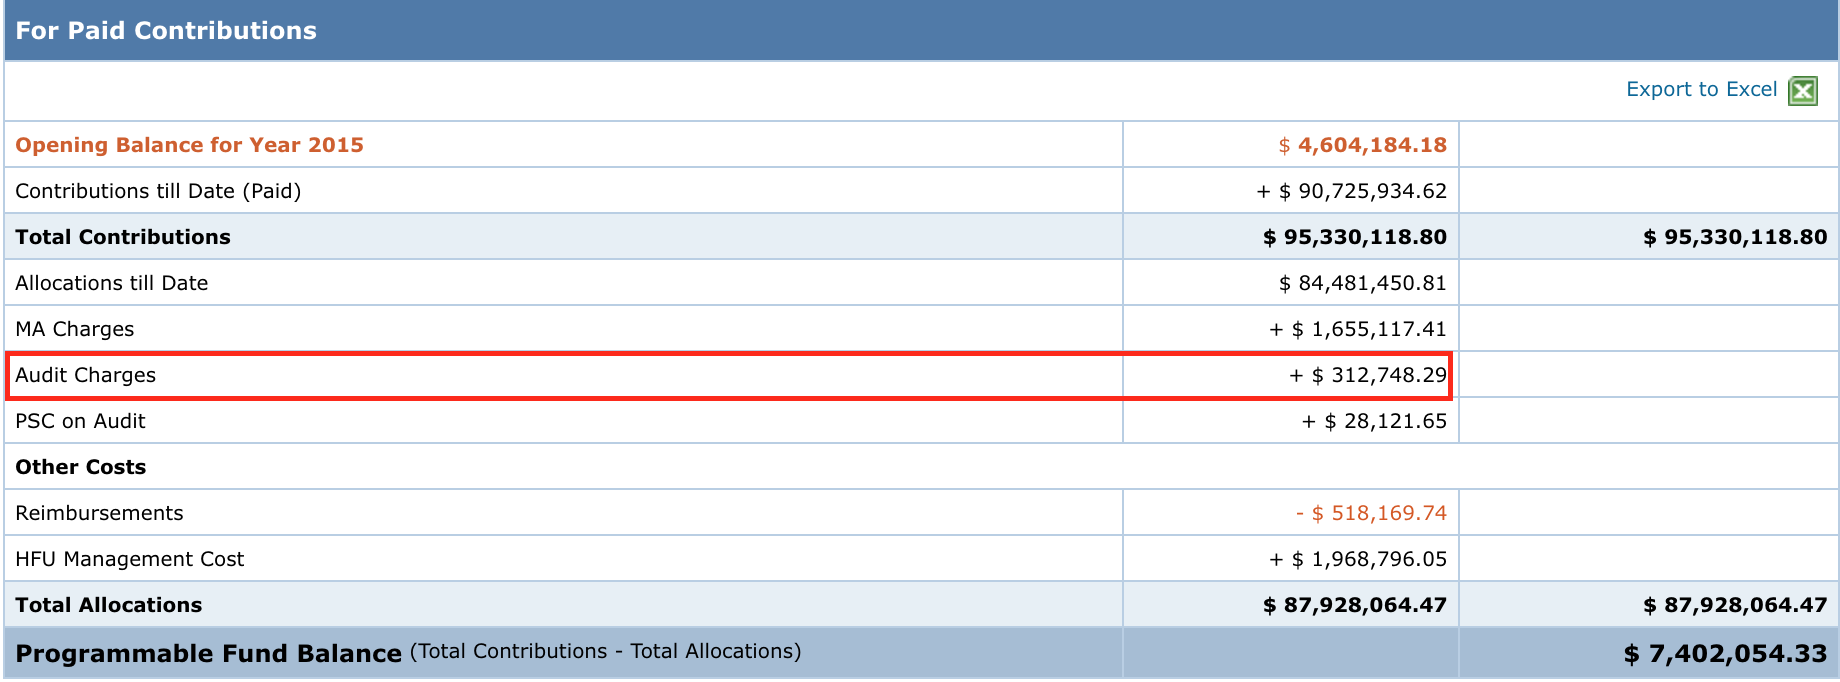
Note:
- In the absence of an actual value in the project (given by the HFU at project closure), the Planned Value will be used.
- For Sharepoint Projects, the “Audit Fees” field (Actual Value from “Closure” tab) to get the Audit Charges. In case this amount is 0, then it would be computed as 13% of “Approved Budget” amount.
PSC on Audit
Displays the total value of Cost Tracking component “MA Charges 2”.
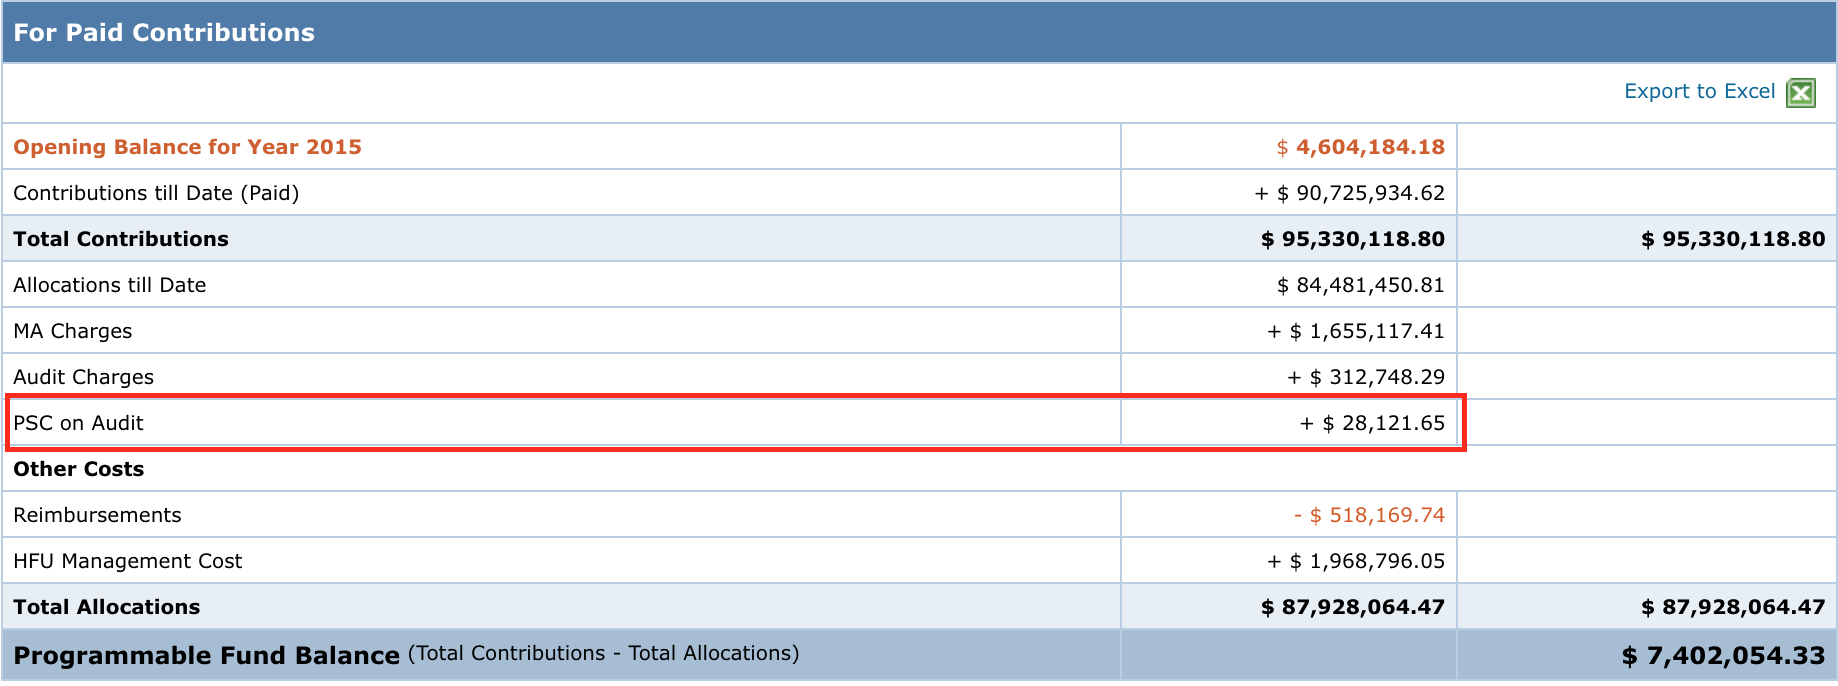
Note:
- In the absence of an actual value in the project (given by the HFU at project closure), the Planned Value will be used.
- Data from Sharepoint Projects will not be computed.
Bank Charges
Displays the total value of Cost Tracking component “Bank Charges”.
Note:
- The row will not be displayed if this component is not configured for a Pooled fund.
- In the absence of an actual value in the project, the Planned Value will be used.
- Data from Sharepoint Projects will not be computed.
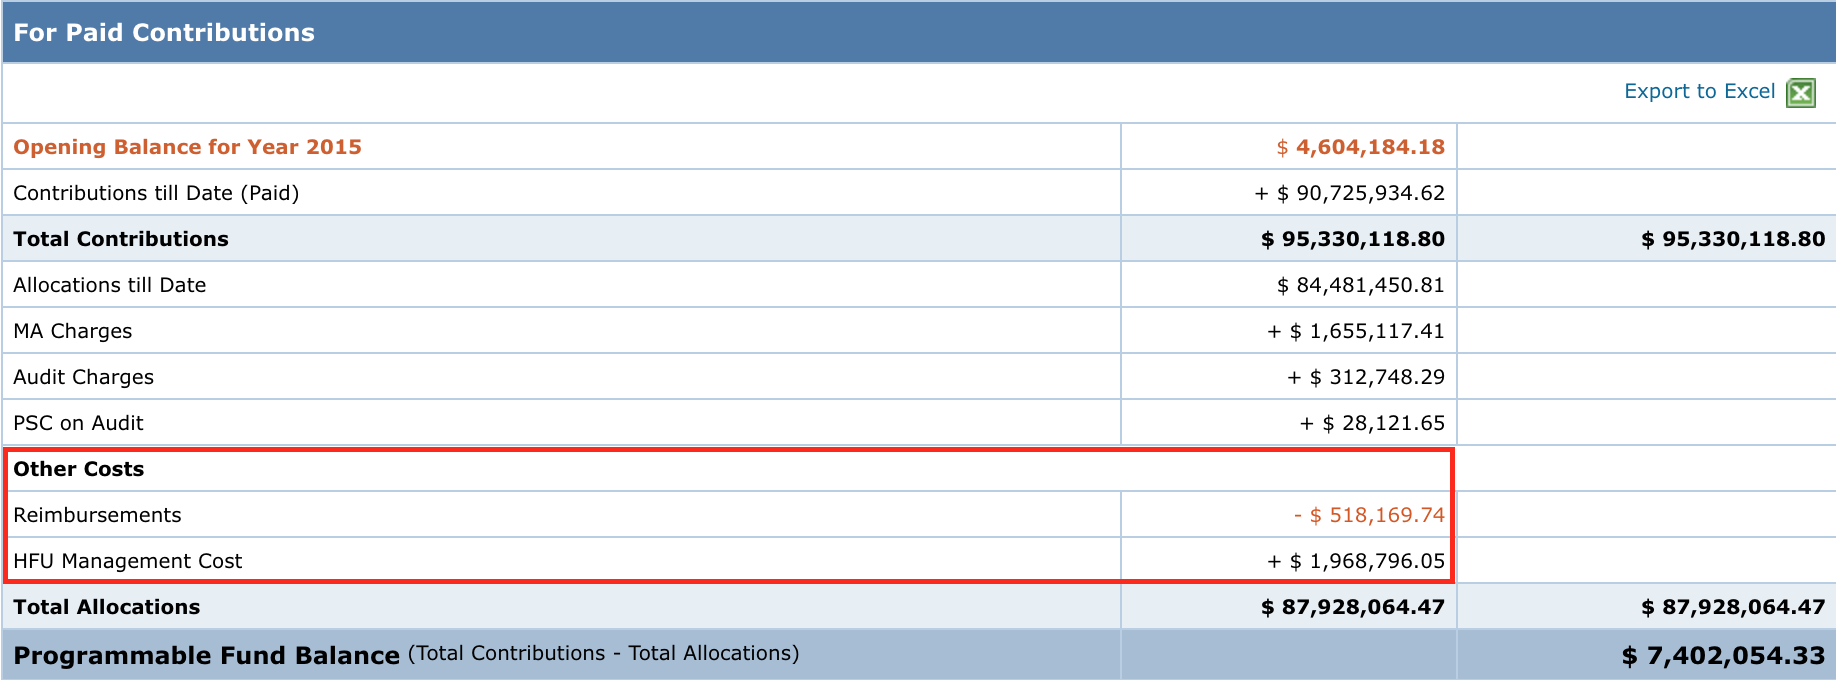
Other Costs (Reimbursements, HFU Management Cost)
-
Reimbursements
Displays the value of refunds that would be computed using the “Reimbursement from Partners” Cost Tracking Component.
Note:
- Value of refunds that were processed between the selected date filters will be considered.
- Data from Sharepoint Projects will not be computed due to data mismatch issues.
- HFU Management Cost
Displays value that would be computed using the Direct Cost total for each year till the end date of Year as set in the filter section.
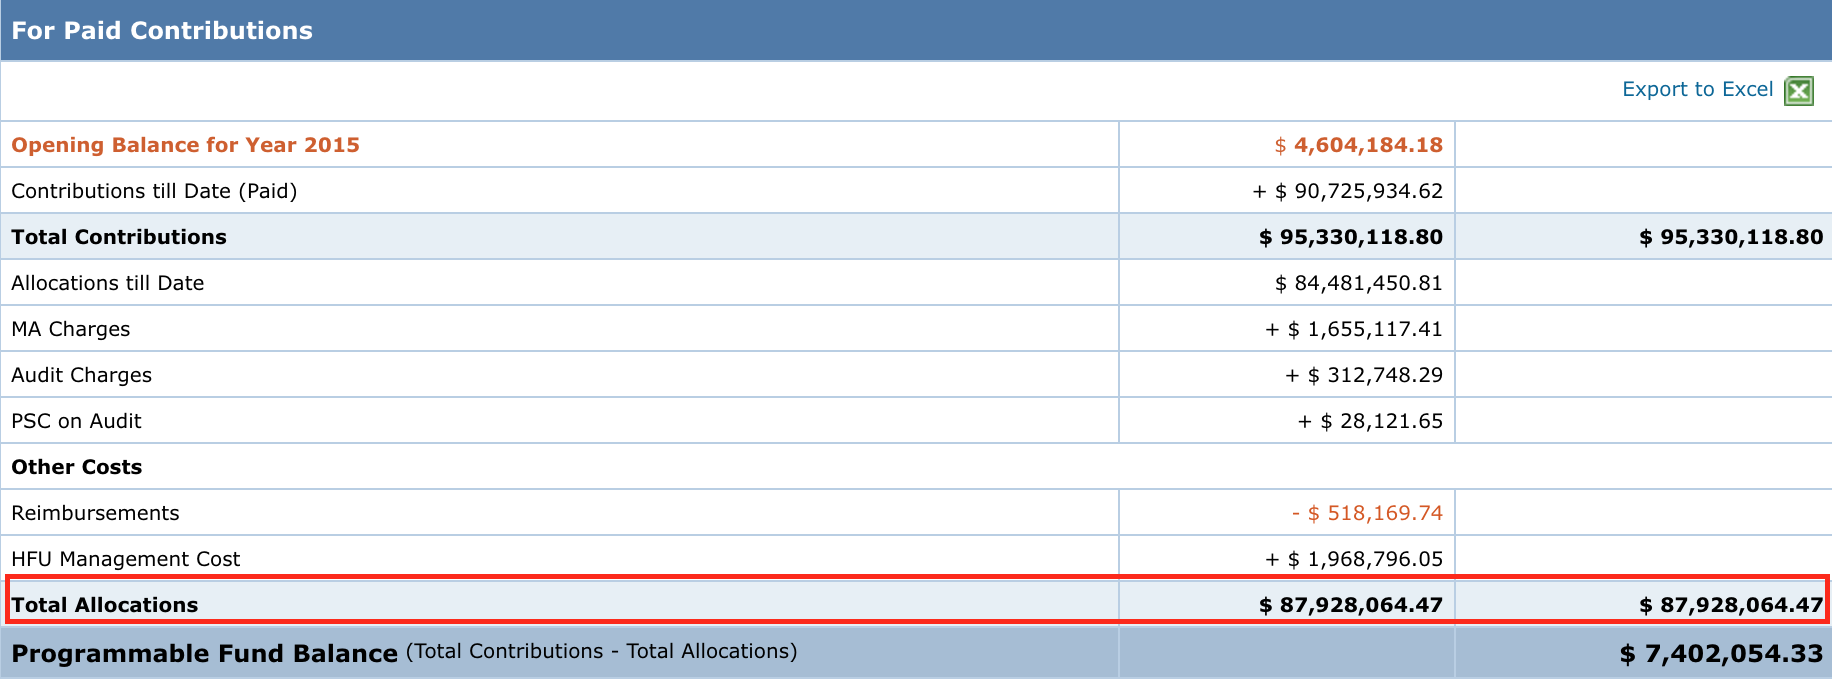
Total Allocations
Displays the total sum of all values (Allocations, MA Charges, Audit Charges, PSC on Audit…) available under the “Approved” column as well as the “Under-Approval Projects” column (if the option is ticked).
Programmable Fund Balance
Displays the difference of value between Total Contributions and Total Allocations.
Contributions – Allocations = Programmable Fund Balance.
FTR Processed Projects
For projects that are under-approval but have been processed in FTR, such projects should actually be part of the Approved Allocation data, but since the projects have not been approved, they won’t be included.
In order to maintain data integrity, this row will display the allocation value of such projects. For FTR Processed Projects, the total would be computed using the actual amount paid in the FTR.
![]()
Note:
- If such cases do not exist, the row will not be displayed.
- If, “Include Under-Approval Projects in Allocation” option is ticked in the filter section, this row will not be displayed because the allocation amount of the FTR Processed projects would be a part of the Under-Approval Allocation sections.
The data displayed to the user can be downloaded in an excel format using the [Export to Excel] button present on the top right-hand corner of the Fund Balance section.
DISCLAIMER
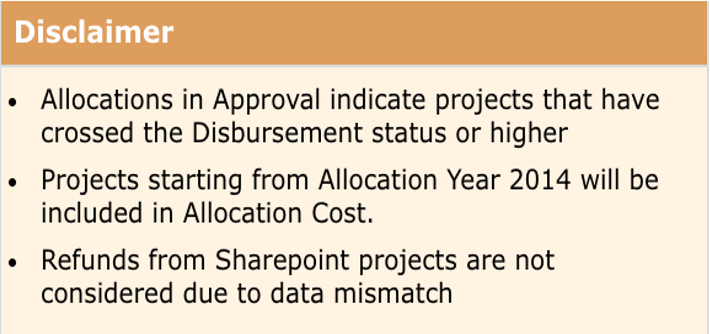
Note: Kindly read the Disclaimer provided so as to have a clear understanding of the limitations of the data provided in the report.
- Allocations in Approval indicate projects that have crossed the Disbursement status or higher.
- The projects that are under approval but FTR for the same has been processed will be displayed under the FTR Processed Projects section. (This disclaimer would be displayed only if FTR Processed Projects is displayed).
- Projects starting from Allocation Year XXX will be included in Allocation Cost. (This disclaimer would be displayed only if Opening Balance Year is configured.)
- For example: For a pooled fund, if the opening balance has been configured for the year 2015, then projects from the year 2014 will also be included. All projects for the years prior to 2014 will not be considered.
- Administrative Agent Fee is computed 1% of Paid Contributions. (This disclaimer would be displayed for MPTF based Pool Funds.)
- Refunds from Sharepoint projects are not considered due to data mismatch.
For all these reasons, the data in this table is purely indicative and should NOT be used to strategize an allocation. Please contact the CBPF Finance team to obtain an actual Fund Balance.