I) What are the different components of the infographic?
II) How to access the data?
CBPFs allow member states and private donors alike to pool their contributions to support specific humanitarian responses. They ensure that timely, coordinated, and principled funding is available and prioritized at the local level by those who are closest to people in need. CBPFs increase predictability of funding and involve frontline responders, including national and local NGOs, in the planning and delivery of humanitarian response.
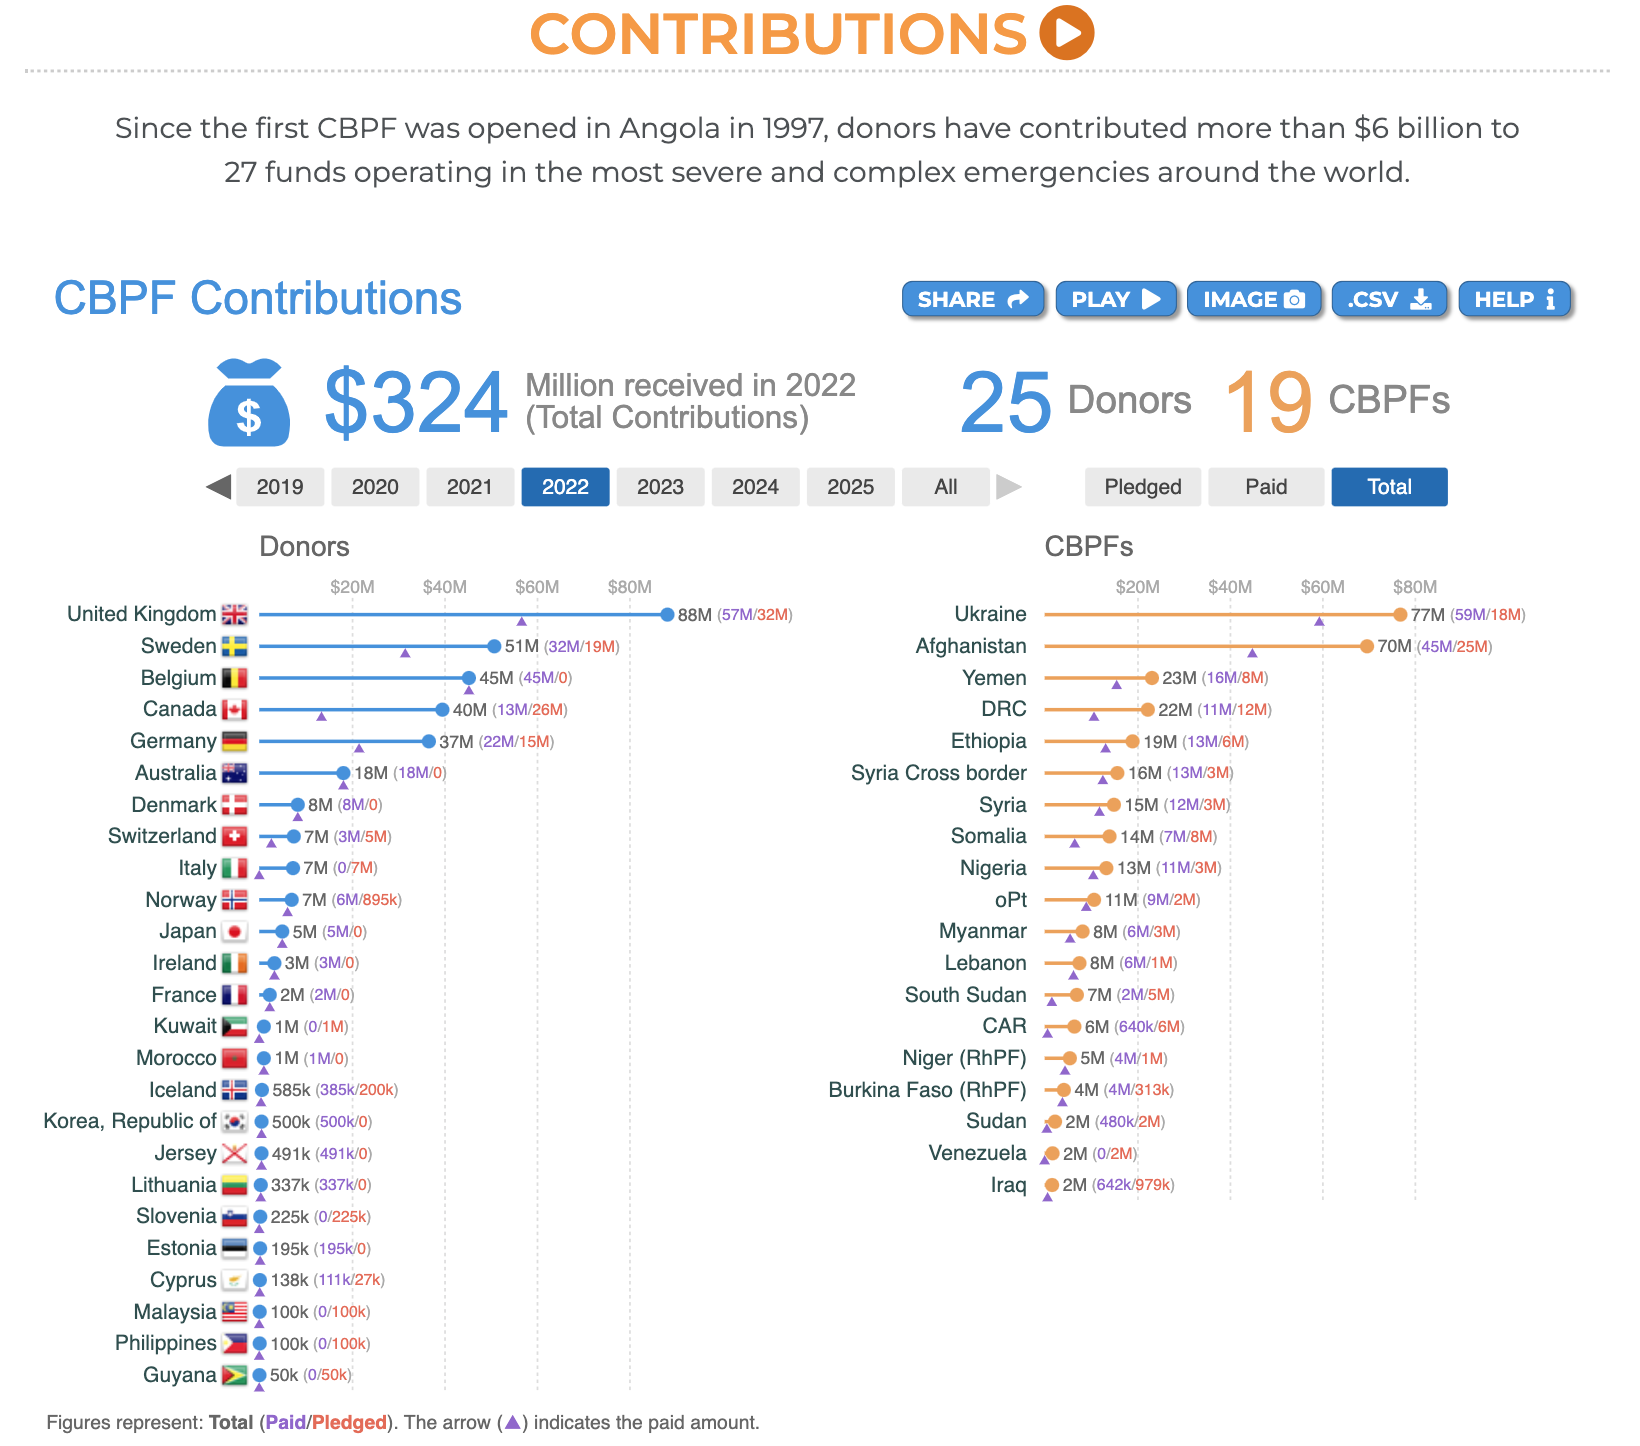
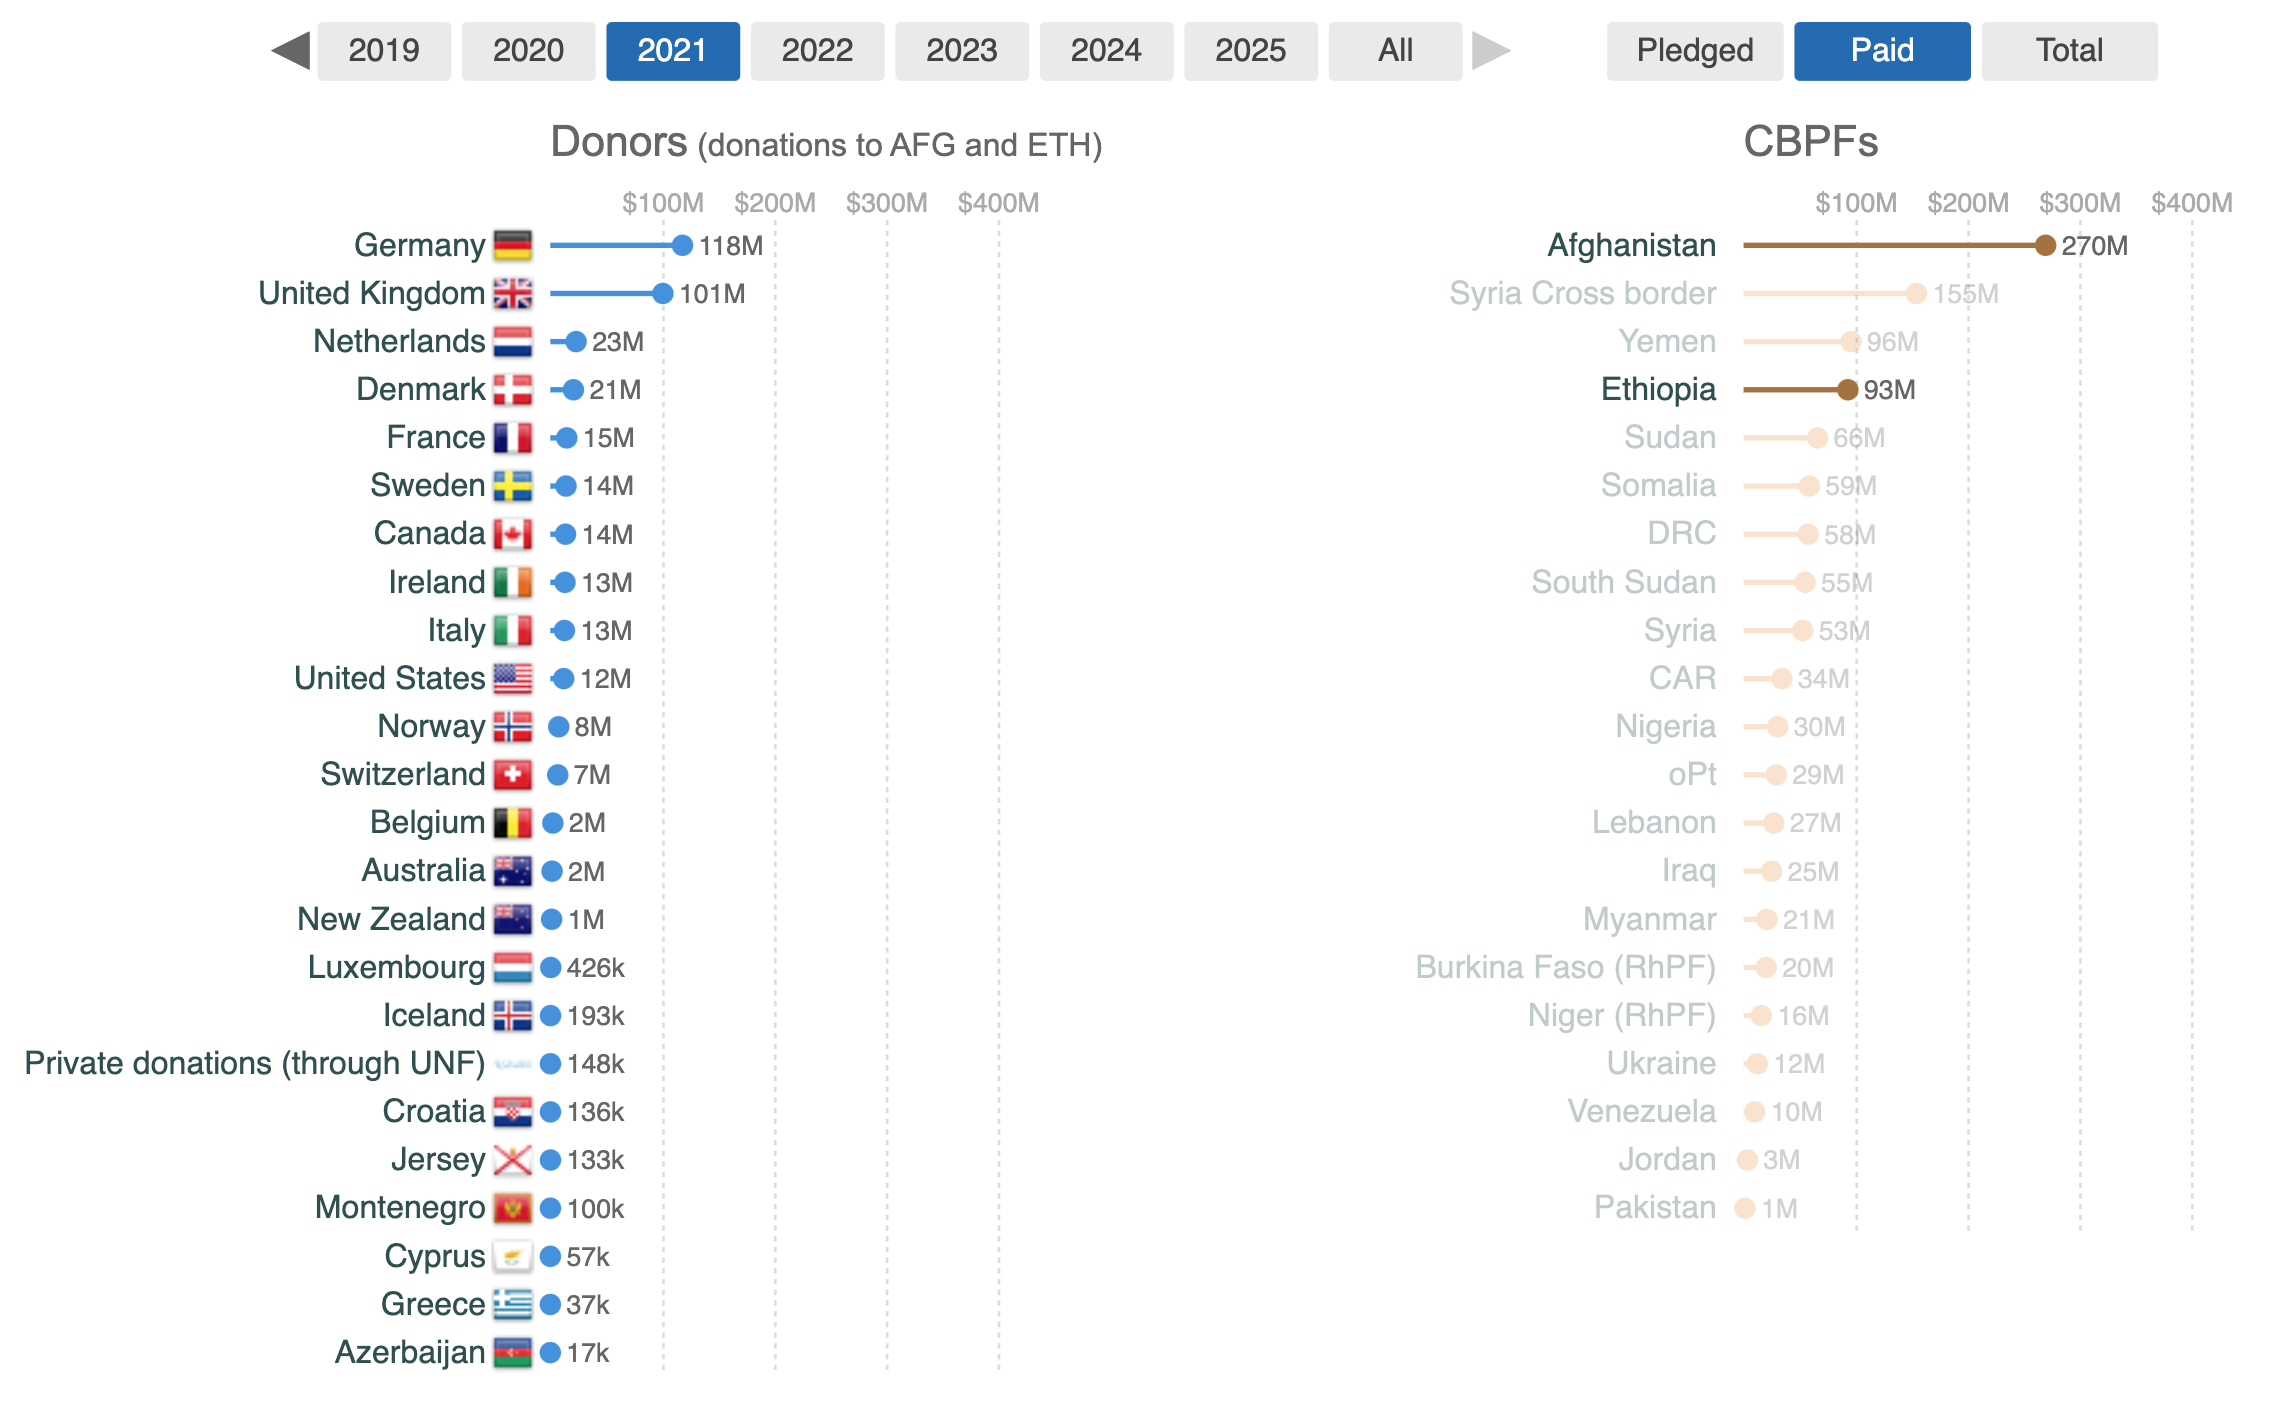
The Contribution visual displays the list of paid contributions and commitments made to CBPFs by year and allows the users to filter the donors’ contributions to the according funded CBPF.
I) What are the different components of the infographic?
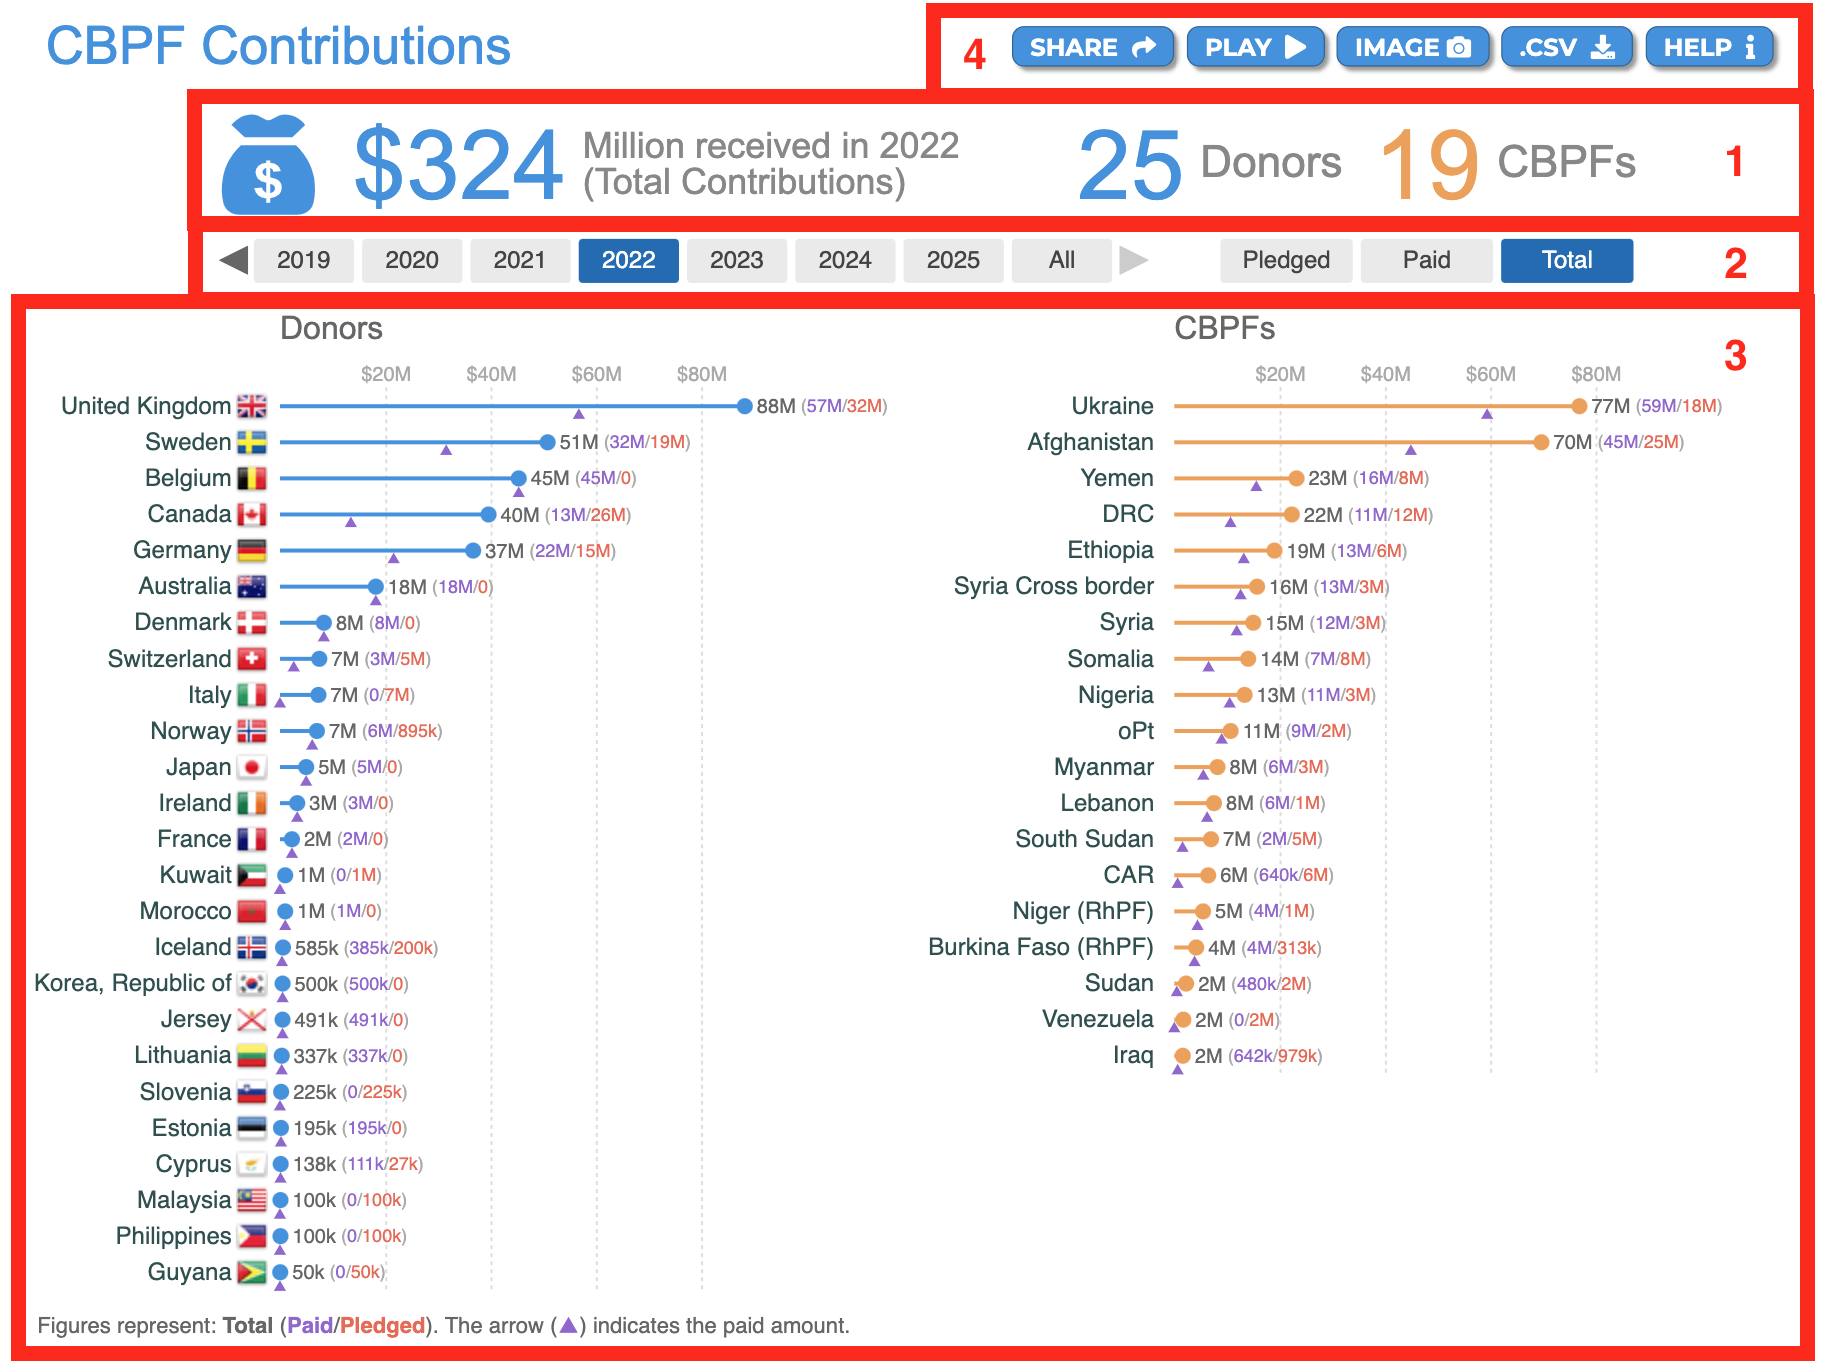
Please see below the description of fields 1-4 as annotated in red in the screenshot above.
-
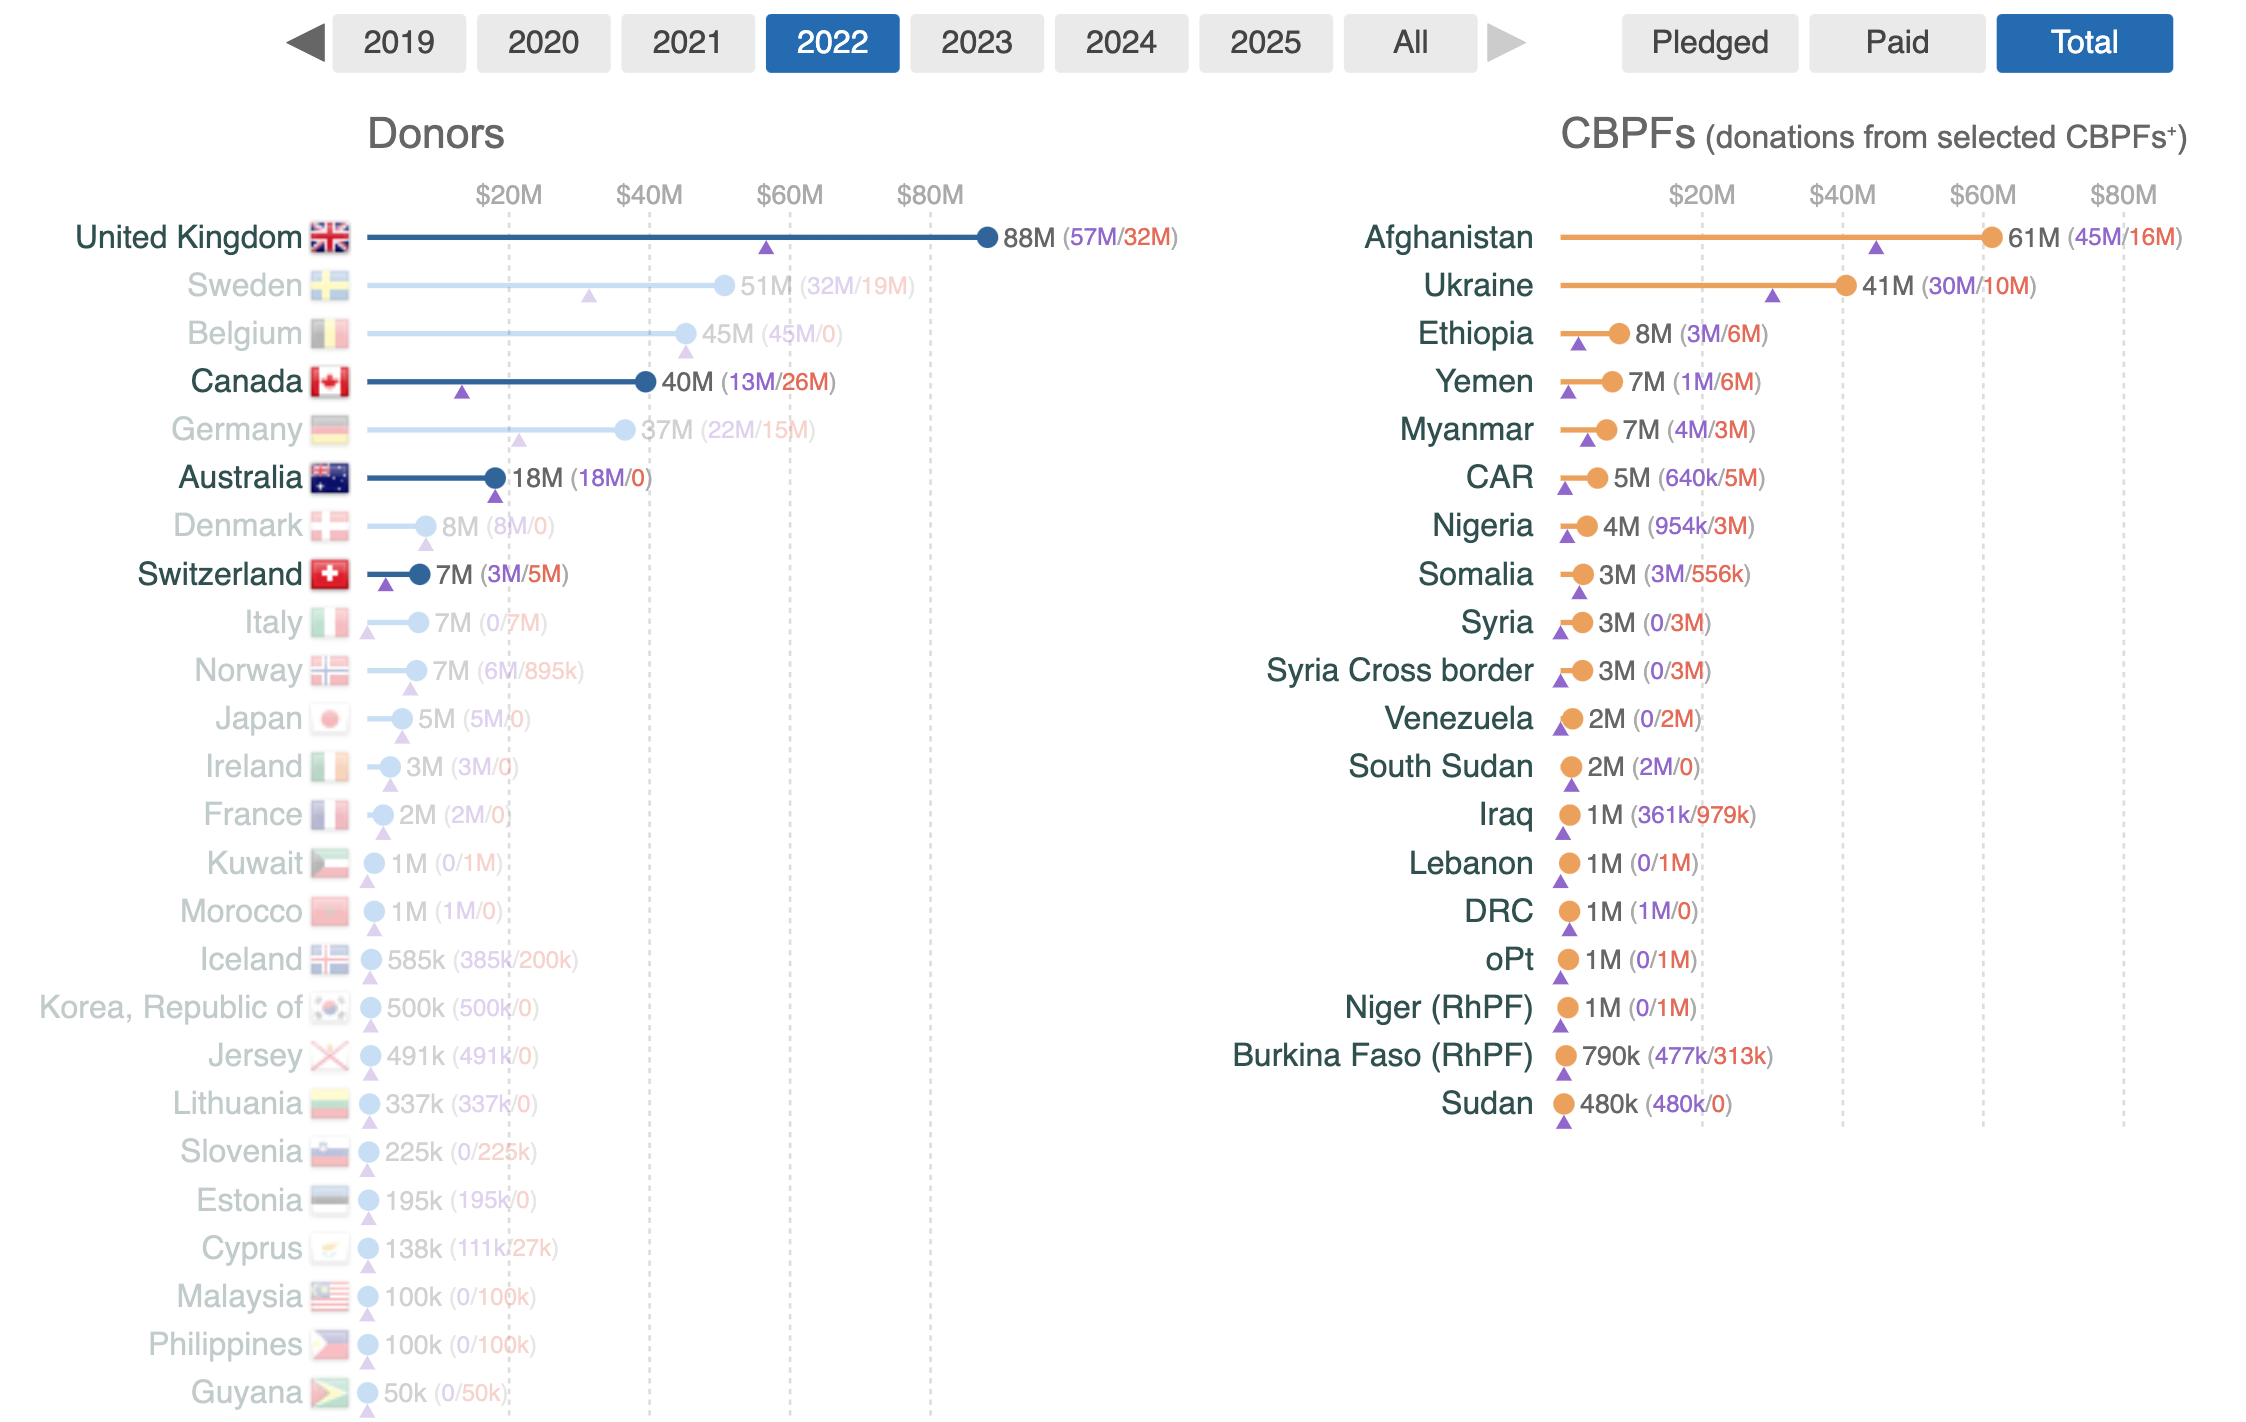
The Allocations’ key figures: they reflect the filters applied, and give the following information:
a. The total contributions received in USD.
b. The number of donors.
c. The number of CBPFs. -
The filters option: users can apply these filters to personalize the data.
a. Year: users can select one year by clicking on it, multiple years by double-clicking on them, or all the years by clicking on [All].
b. Contributions: users can select the Pledged contributions, the Paid contributions or both by clicking on [All]. -
The bar charts:
a. Donors bar chart: displays the paid and pledged amount in USD by donors.
b. CBPFs bar chart: displays the paid and pledged amount in USD received by CBPFs. -
The usual CBPF Data Hub tooltips: Share, Play, Image, .CSV, and Help. To know more about these tooltips, please click here.
The CBPFs Contribution visualization provides data at two levels:
-
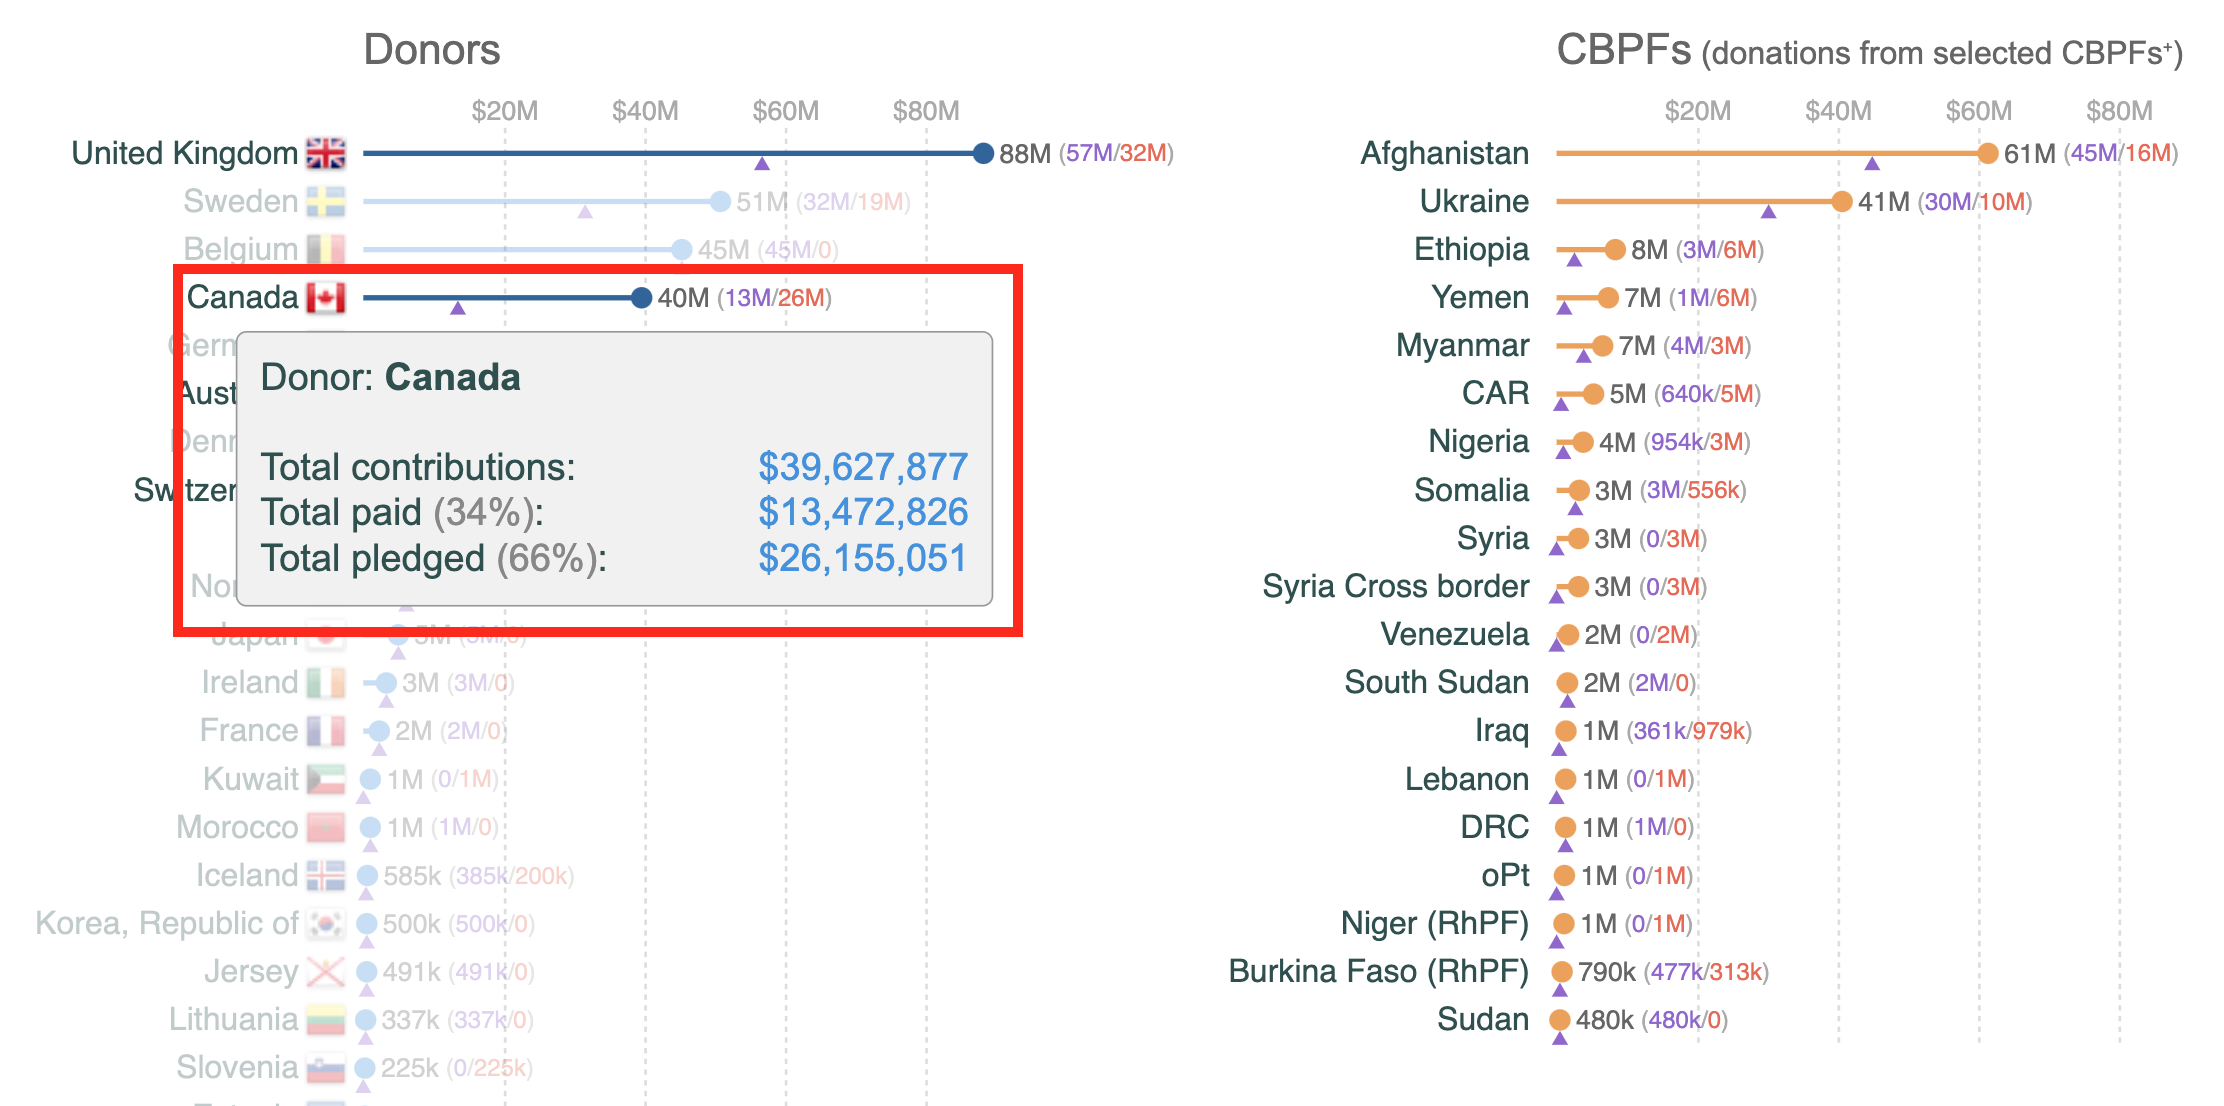
The Donors chart shows the paid and pledged amounts by all donors.
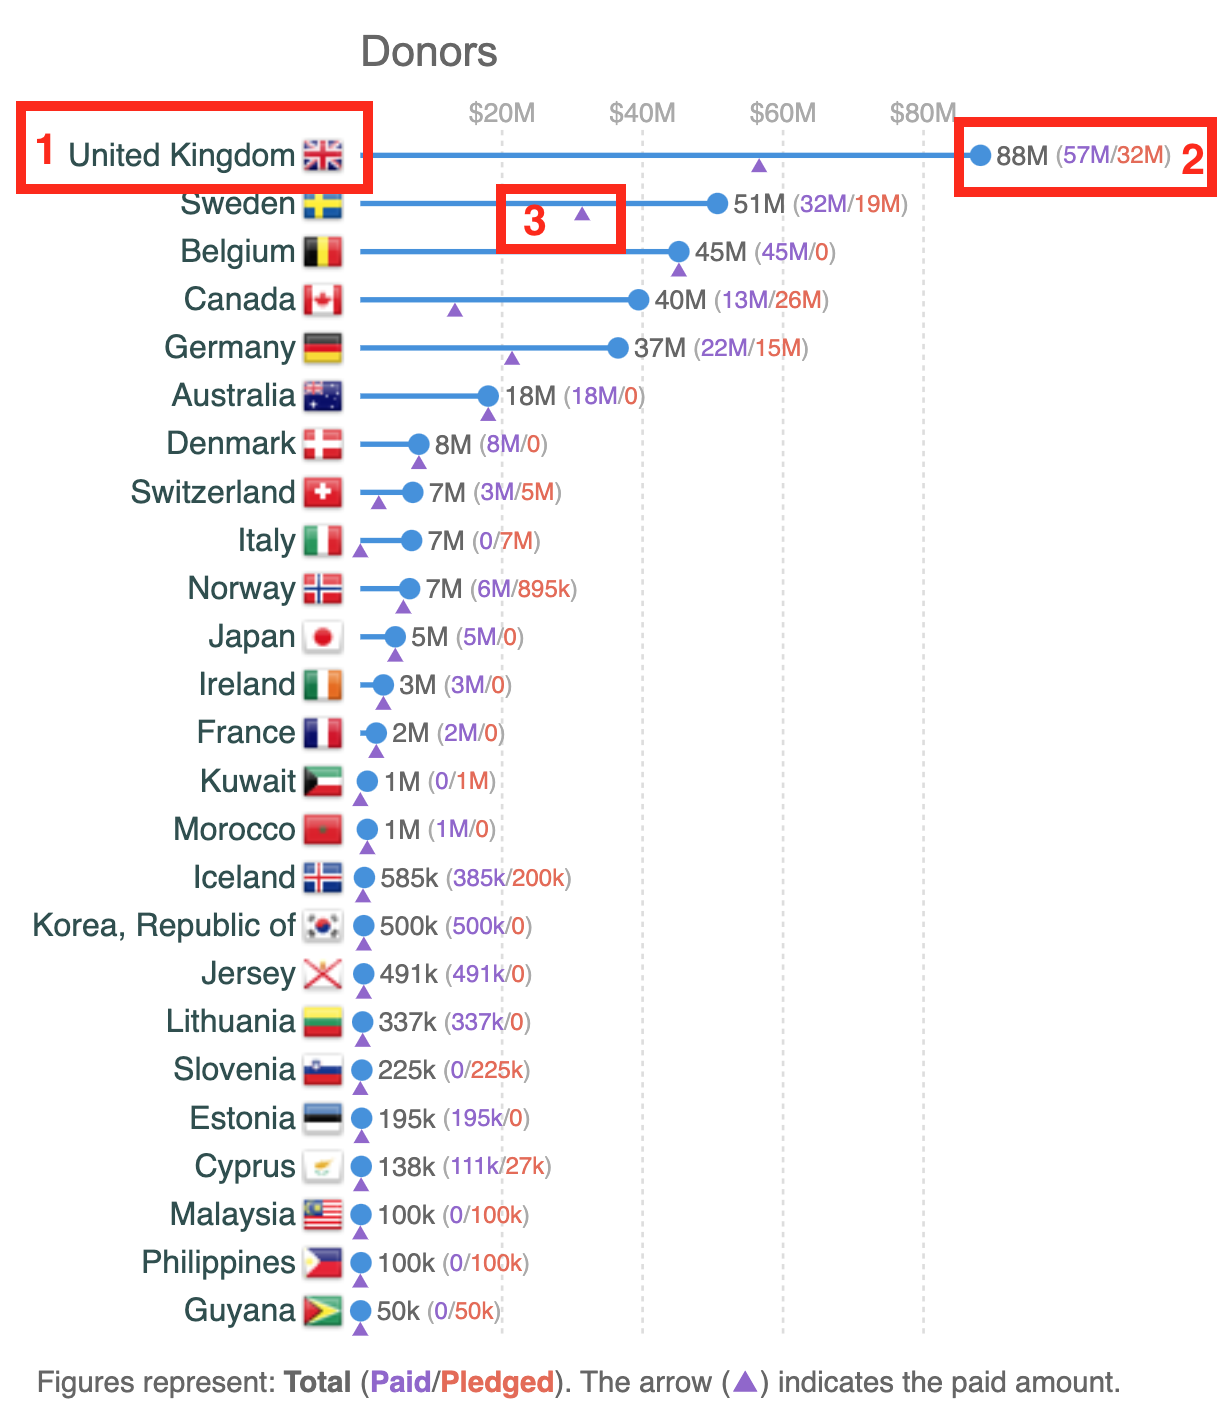
The Donors chart provides the following information:
-
The donors.
-
The first number is the total contribution in USD. Between brackets, the amount in purple is the amount paid by the donor and the amount in orange is the amount pledged by the donor.
Please note: when you select either the Paid or the Pledged filters only one amount will be displayed corresponding to your filter. -
The arrow icon
 indicates the paid amount.
You can select one or several donor(s) by clicking on it/them and the CBPFs chart will reflect the CBPFs that the selected donor(s) has contributed to.
Hover over the Donor’s name to have more information on its contributions.
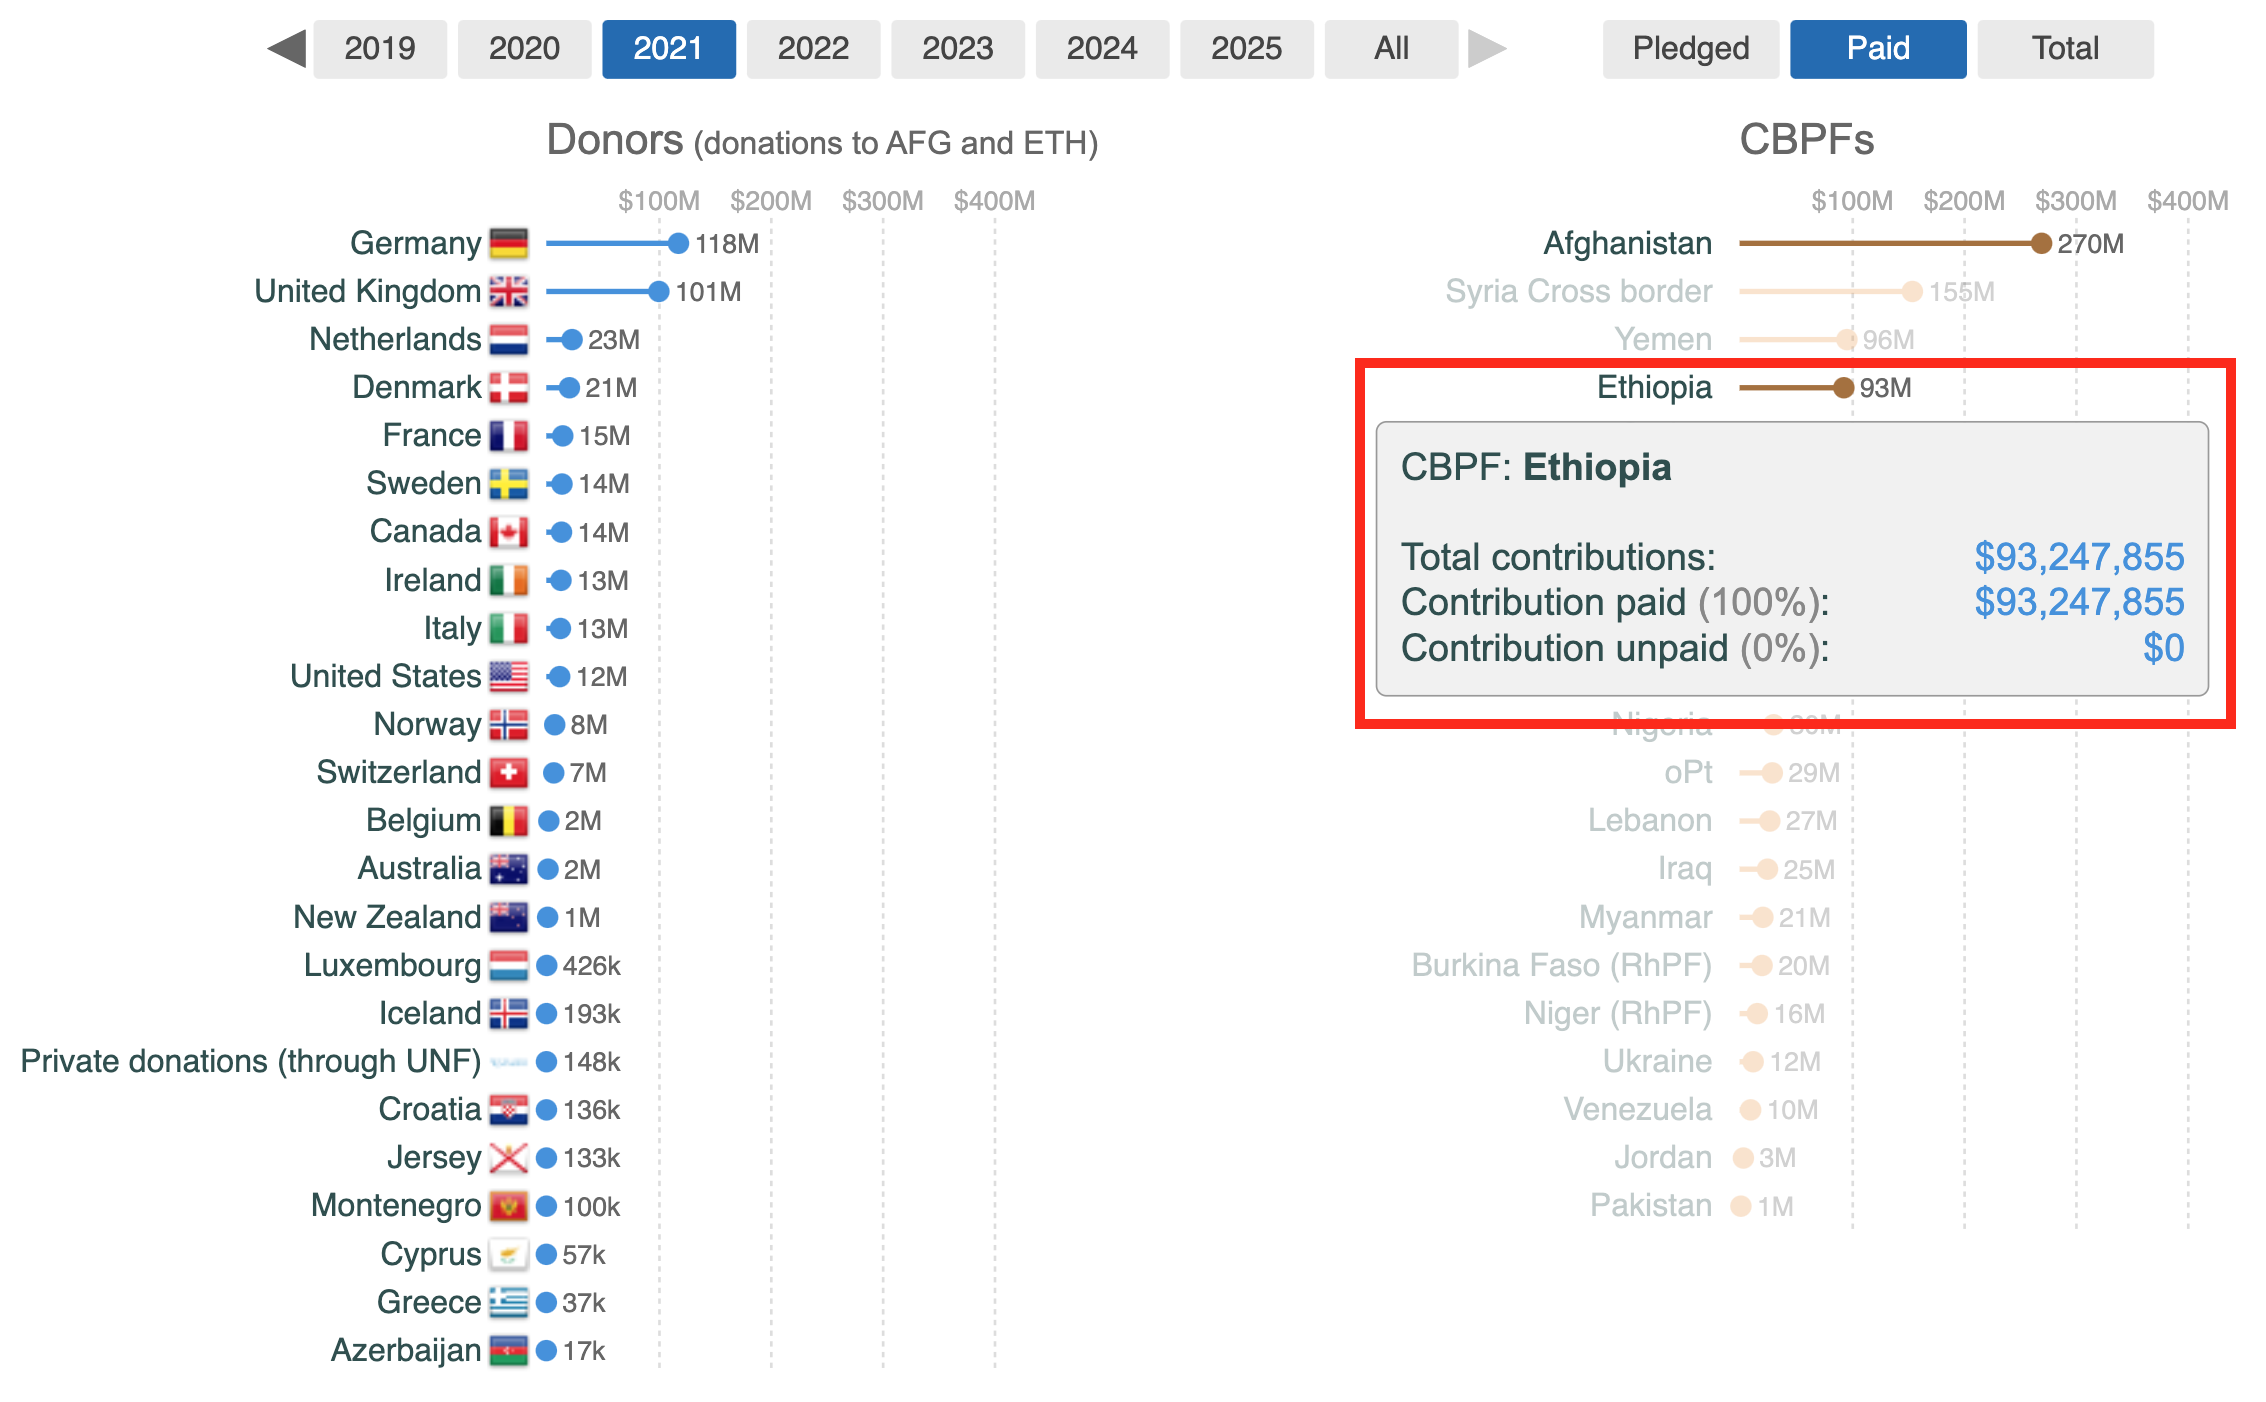
2. The CBPFs chart displays the paid and pledged amount in USD received by CBPFs
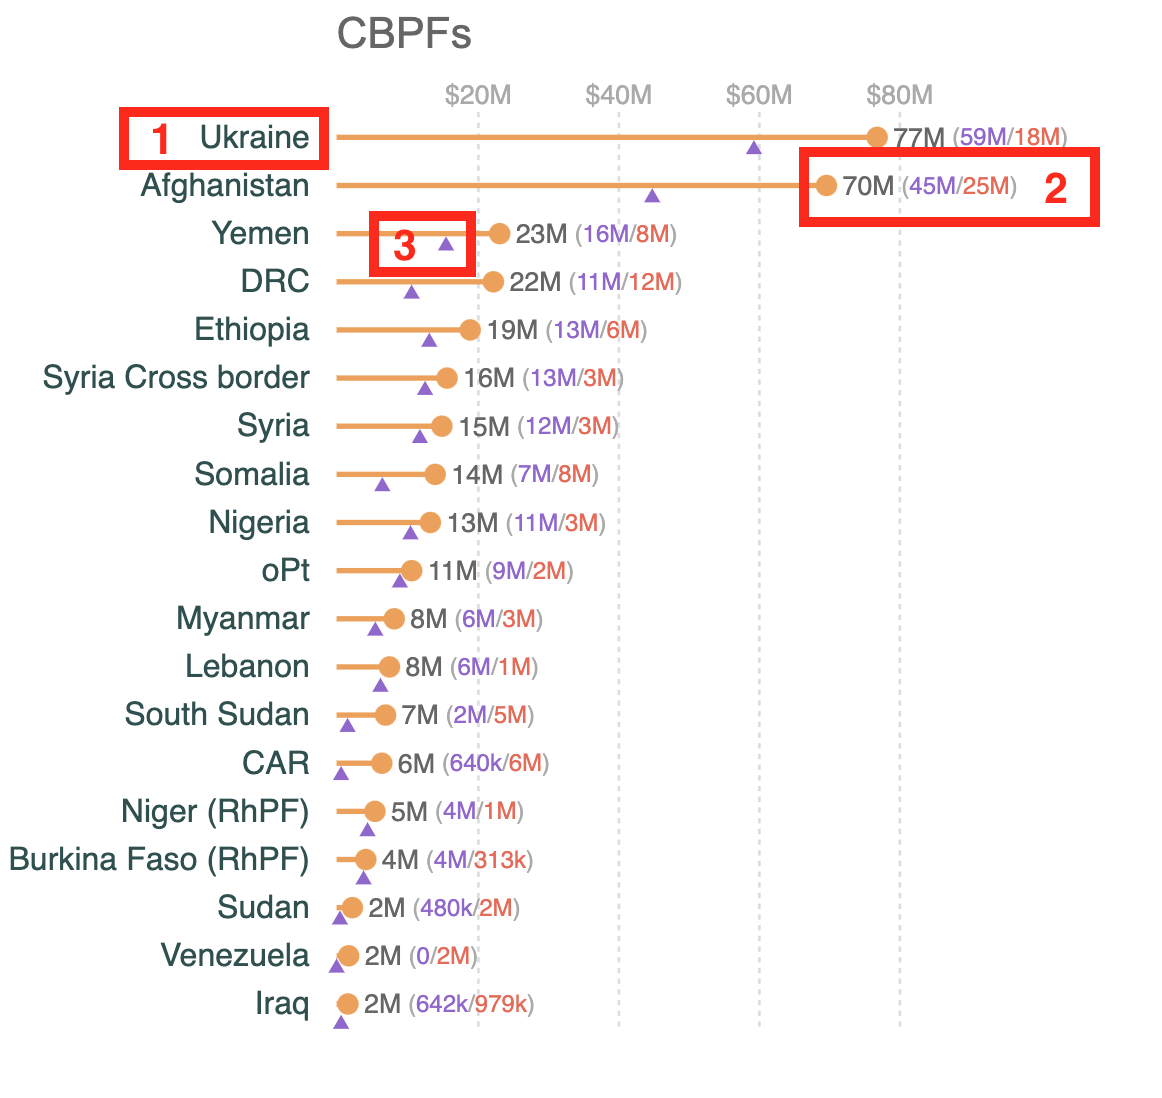
The CBPFs chart provides the following information:
-
The fund name.
-
The first number is the total amount in USD contributed by the donor(s) to the fund. Between brackets, the amount in purple is the amount received by the fund and the amount in orange is the amount pledged by the donor(s).
Please note: when you select ether the Paid or the Pledged filters only one amount will be displayed corresponding to your filter. -
The arrow icon
 indicates the received amount.
You can select one or several fund(s) by clicking on it/them and the Donors chart will show the donors who contributed to the fund(s).
Hover over the fund’s name to have more information on the contributions received.