The Partner Risk Dashboard allows HFU officers to generate a list of all partners with a breakdown of the different components of their risk level.
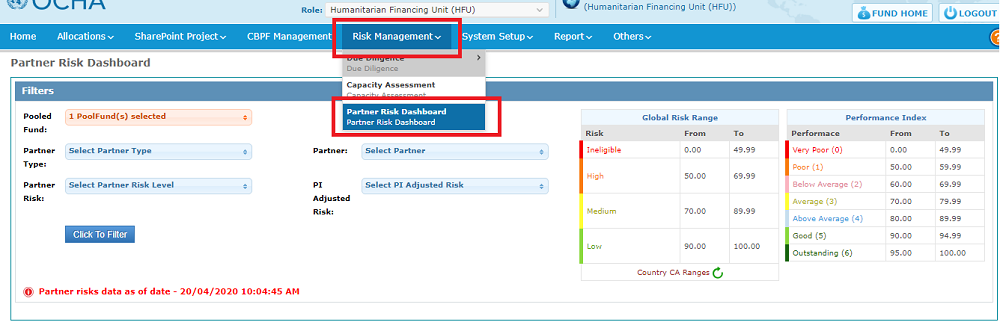
To access the Partner Risk dashboard, follow this navigation: Risk Management -> Partner Risk Dashboard
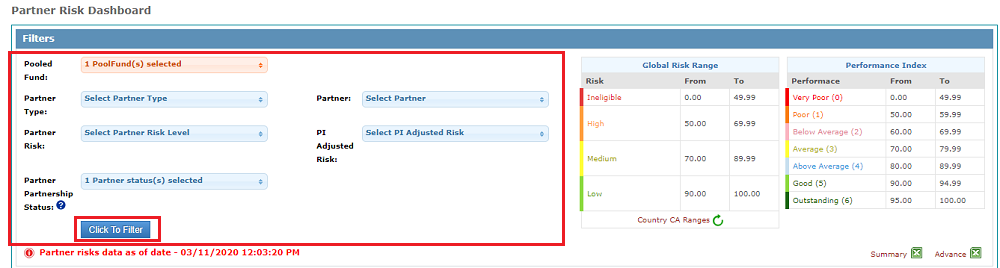
Use the Filters section at the top, to select the partners which performance dashboard you would like to access. Apply the wanted filters and click on [Click to filter] to obtain the list of corresponding partners.
Please note: if you do not apply filters and click on [Click to filter], the system will provide a list of all partners.
Field Descriptions:
• Pooled Fund(s): Displays the Pooled Fund(s) to which you have an access. By default, the Pooled Fund you are currently in will be selected.
• Partner Type: Displays the different types of partners in GMS.
• Partner Risk Level: Displays the different risk levels in GMS (Ineligible, Low, Medium and High) that the partners currently have. [Old terminology: current or running risk]
• Partner: Displays the different partners for the pooled funds selected. The pooled fund is mentioned as a prefix because one partner might have a different name in different funds. For example, OCHA could be registered as OCHA in the Iraq CBPF and as OCHA Myanmar in the Myanmar CBPF.
• PI Adjusted Risk: Displays the different risk levels in GMS (Ineligible, Low, Medium and High) that are currently calculated by the system for the partners. [Old terminology: calculated risk]
• Partner Partnership Status: Displays the two following options: ‘Active’ and ‘Inactive’. Select 'Active' to display all partners that are currently active on the GMS. Select 'Inactive' to display the suspended, dis-enrolled or ineligible partners.
Important to Note: The system will not display live data on the PI Dashboard, it will be refreshed every 2 hours. The date and time (always shown according to Geneva time, UTC +1) at which the data was taken for the displayed PI Dashboard is indicated in red above the table.
The Partner Risk Dashboard follow this colour legend:
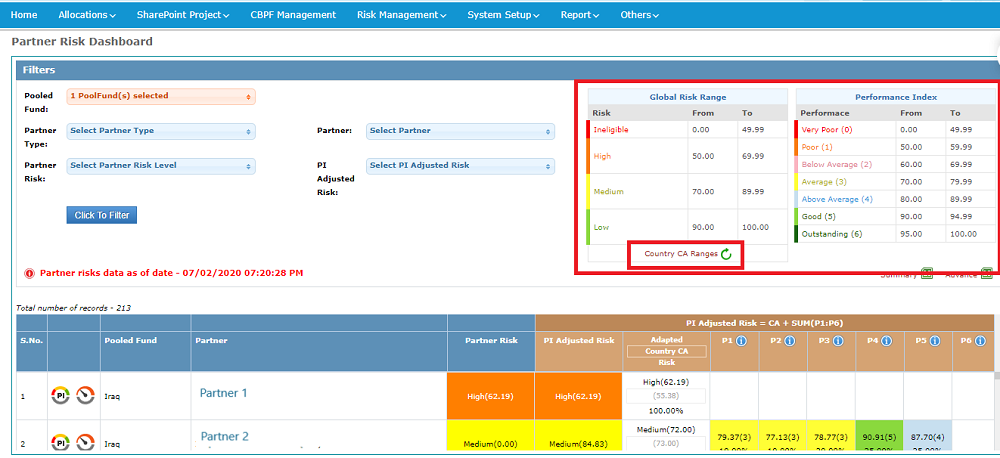
Color legends:
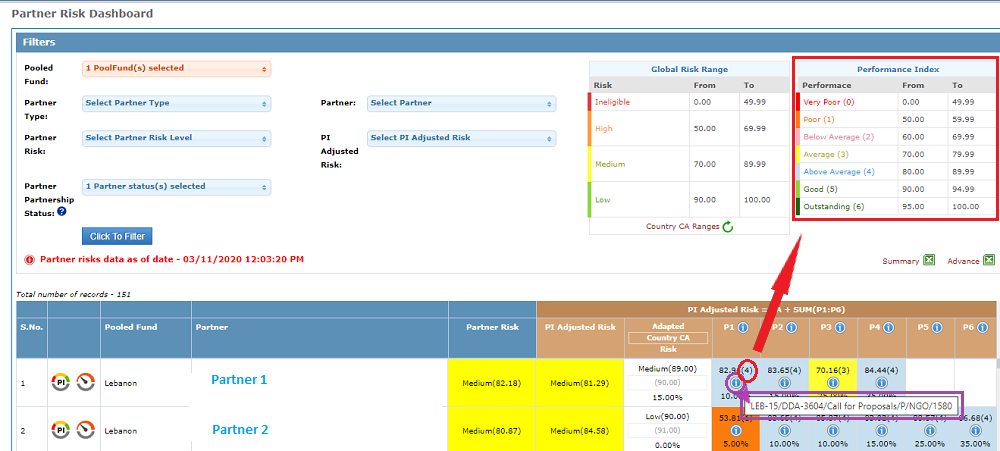
• Partner Performance Index: Displays the colours used to determine the PI for each project.
• Global Risk Range: Displays the colours used to determine the Partner Risk Level and PI Adjusted Risk. These figures represent the Global Risk Ranges, as can be found in the Global Operational Manual.
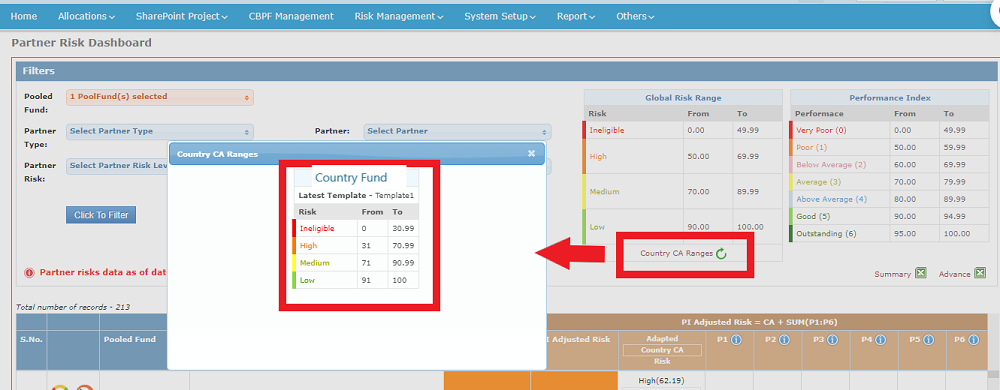
To access your Country CA range as set in your Fund’s Operational Manual, and approved by your Advisory Board, click on [Country CA Range]. A pop-up window displays your Country CA range.
Once you click to filer, the list of partners is generated below the filter section.
Please note: users will be able to Export the PI Dashboard to Excel by clicking on one of the Excel icons, either to get a summary view, or a more advance view, containing more data.
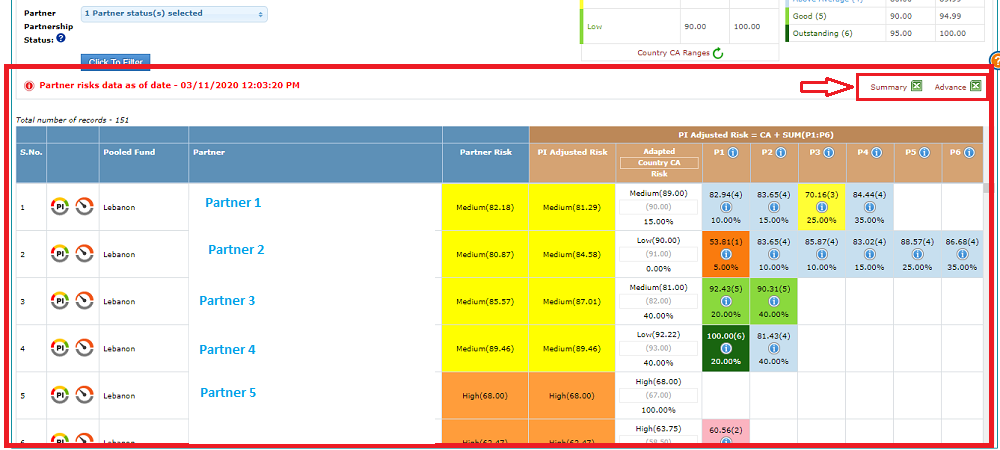
Column Descriptions of the Dashboard’s list:
• S.No: Number attributed to the partner in the list.
• Pooled Fund: Displays the Pooled Fund of the Partner.
• Partner: Displays the name of the Partner in a specific Pooled Fund.
• Partner Risk: Displays the current Risk Level a Partner has in the system.
• PI (Performance Index) Adjusted Risk: Displays the risk as calculated by the system for a specific Partner – this may or may not have been accepted by the HFU user.
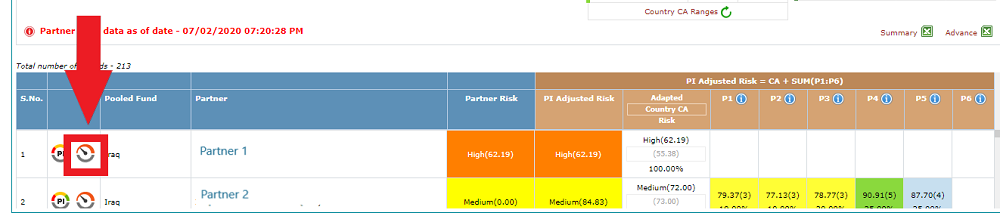
• Adapted Country CA Risk: Displays in black the adapted CA score (from country range to global range using the multiplier) and in grey the actual country CA score.
• P1 – P6: Displays the score a Partner received for their projects. P1 is the first project, the last column value refers to the most recent project of that Partner. The Formula to calculate the PI Adjusted Risk is CA + SUM (P1:P6).
API score is calculated for each project and displayed in the column with its overall score and the percentage below indicates the weightages given to this score in the formula. You can hover over the Information icon  to know which project is related to each PI score. Moreover, the number between brackets next to the score indicates to which PI Performance row the project is related to.
The second column of the table shows two tooltips for each partner:  and
and  .
.
The First tooltip of the partner’s line, , labelled PI, redirects the user to the Performance Management Page.
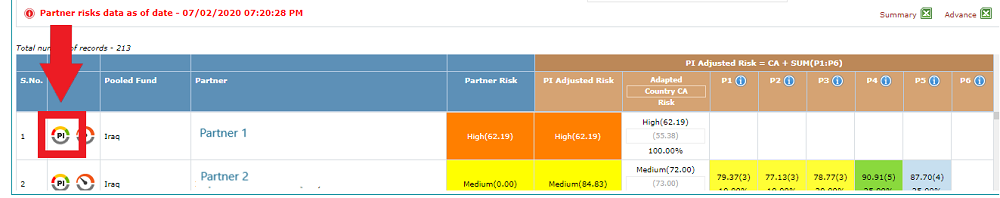
The second tooltip of the partner’s line , redirects the user to the Partner Performance Index Risk Management.